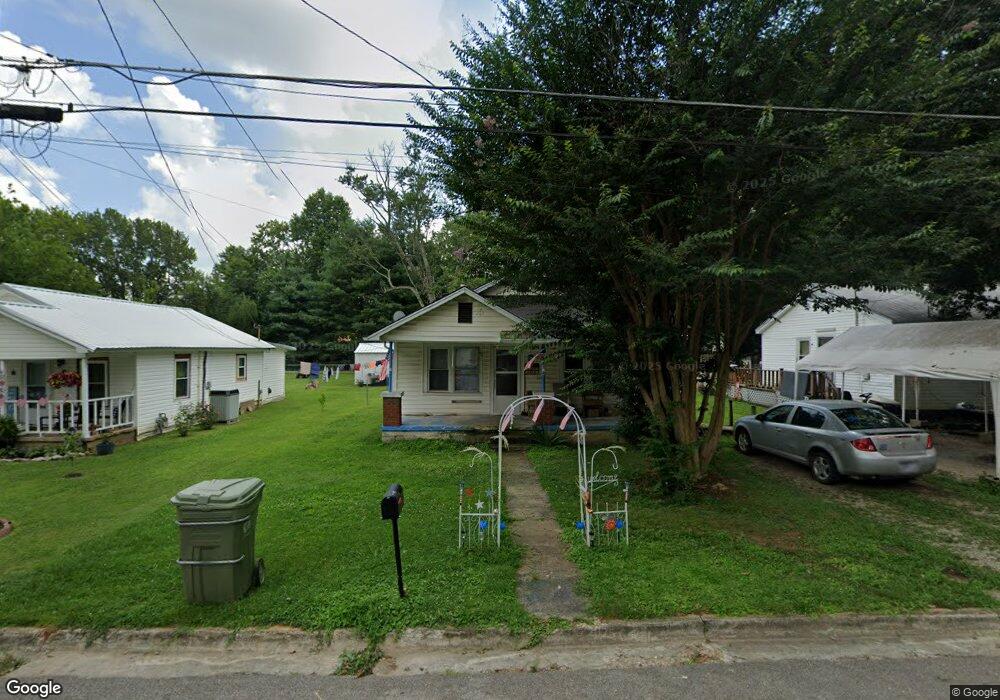
529 3rd St Lawrenceburg, TN 38464
Estimated Value: $75,000 - $149,000
--
Bed
1
Bath
728
Sq Ft
$133/Sq Ft
Est. Value
About This Home
This home is located at 529 3rd St, Lawrenceburg, TN 38464 and is currently estimated at $96,560, approximately $132 per square foot. 529 3rd St is a home located in Lawrence County with nearby schools including Ingram Sowell Elementary School, Lawrenceburg Public Elementary School, and David Crockett Elementary School.
Ownership History
Date
Name
Owned For
Owner Type
Purchase Details
Closed on
Aug 3, 2011
Sold by
Hoar Syble Janette
Bought by
White John M
Current Estimated Value
Purchase Details
Closed on
Oct 7, 1994
Bought by
Hoar Syble Janette First Farmers & Merchants
Purchase Details
Closed on
Nov 3, 1989
Bought by
Christian Charles R
Purchase Details
Closed on
Apr 18, 1989
Bought by
Bivens Ralph L Shedd Jerry
Purchase Details
Closed on
Feb 24, 1984
Bought by
Smith William Joseph
Purchase Details
Closed on
Jan 1, 1982
Create a Home Valuation Report for This Property
The Home Valuation Report is an in-depth analysis detailing your home's value as well as a comparison with similar homes in the area
Home Values in the Area
Average Home Value in this Area
Purchase History
| Date | Buyer | Sale Price | Title Company |
|---|---|---|---|
| White John M | $12,000 | -- | |
| Hoar Syble Janette First Farmers & Merchants | $28,500 | -- | |
| Christian Charles R | $25,000 | -- | |
| Bivens Ralph L Shedd Jerry | $18,000 | -- | |
| Smith William Joseph | -- | -- | |
| -- | $9,600 | -- |
Source: Public Records
Tax History Compared to Growth
Tax History
| Year | Tax Paid | Tax Assessment Tax Assessment Total Assessment is a certain percentage of the fair market value that is determined by local assessors to be the total taxable value of land and additions on the property. | Land | Improvement |
|---|---|---|---|---|
| 2025 | $382 | $12,275 | $0 | $0 |
| 2024 | $382 | $12,275 | $1,500 | $10,775 |
| 2023 | $382 | $12,275 | $1,500 | $10,775 |
| 2022 | $382 | $12,275 | $1,500 | $10,775 |
| 2021 | $279 | $6,350 | $1,500 | $4,850 |
| 2020 | $279 | $6,350 | $1,500 | $4,850 |
| 2019 | $279 | $6,350 | $1,500 | $4,850 |
| 2018 | $279 | $6,350 | $1,500 | $4,850 |
| 2017 | $279 | $6,350 | $1,500 | $4,850 |
| 2016 | $279 | $6,350 | $1,500 | $4,850 |
| 2015 | $264 | $6,350 | $1,500 | $4,850 |
| 2014 | $261 | $6,275 | $1,500 | $4,775 |
Source: Public Records
Map
Nearby Homes