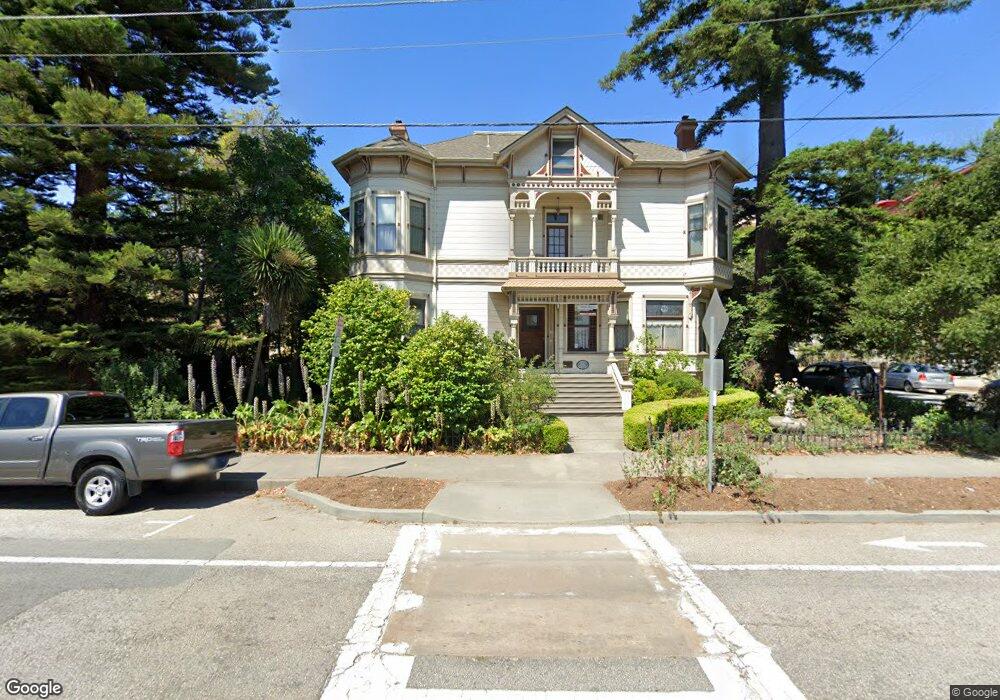
529 Chestnut St Santa Cruz, CA 95060
Downtown Santa Cruz NeighborhoodEstimated Value: $2,921,564
11
Beds
6
Baths
6,600
Sq Ft
$443/Sq Ft
Est. Value
About This Home
This home is located at 529 Chestnut St, Santa Cruz, CA 95060 and is currently estimated at $2,921,564, approximately $442 per square foot. 529 Chestnut St is a home located in Santa Cruz County with nearby schools including Westlake Elementary School, Mission Hill Middle School, and Santa Cruz High School.
Ownership History
Date
Name
Owned For
Owner Type
Purchase Details
Closed on
Nov 16, 2021
Sold by
Sprinsock Brion and Albrecht Kristine
Bought by
Hinds House Llc
Current Estimated Value
Purchase Details
Closed on
Nov 2, 2021
Sold by
Hinds House Llc
Bought by
Sprinsock Brian and Albrecht Kristine
Purchase Details
Closed on
Jan 13, 2004
Sold by
Mock Sandra F
Bought by
Hinds House Llc
Home Financials for this Owner
Home Financials are based on the most recent Mortgage that was taken out on this home.
Original Mortgage
$975,000
Interest Rate
3.45%
Mortgage Type
Commercial
Purchase Details
Closed on
Oct 10, 2002
Sold by
Mock Stanley C and Mock Sandra F
Bought by
Mock Sandra F
Purchase Details
Closed on
Jun 26, 2001
Sold by
Mock Stanley C and Mock Sandra F
Bought by
Mock Stanley C and Mock Sandra F
Home Financials for this Owner
Home Financials are based on the most recent Mortgage that was taken out on this home.
Original Mortgage
$275,000
Interest Rate
7.14%
Mortgage Type
Commercial
Create a Home Valuation Report for This Property
The Home Valuation Report is an in-depth analysis detailing your home's value as well as a comparison with similar homes in the area
Home Values in the Area
Average Home Value in this Area
Purchase History
| Date | Buyer | Sale Price | Title Company |
|---|---|---|---|
| Hinds House Llc | -- | None Available | |
| Sprinsock Brian | -- | Amrock Llc | |
| Hinds House Llc | $1,300,000 | Santa Cruz Title Company | |
| Mock Sandra F | -- | -- | |
| Mock Stanley C | -- | Santa Cruz Title Company |
Source: Public Records
Mortgage History
| Date | Status | Borrower | Loan Amount |
|---|---|---|---|
| Previous Owner | Hinds House Llc | $975,000 | |
| Previous Owner | Mock Stanley C | $275,000 |
Source: Public Records
Tax History Compared to Growth
Tax History
| Year | Tax Paid | Tax Assessment Tax Assessment Total Assessment is a certain percentage of the fair market value that is determined by local assessors to be the total taxable value of land and additions on the property. | Land | Improvement |
|---|---|---|---|---|
| 2025 | $18,944 | $1,706,160 | $710,900 | $995,260 |
| 2023 | $18,714 | $1,639,908 | $683,295 | $956,613 |
| 2022 | $18,482 | $1,607,753 | $669,897 | $937,856 |
| 2021 | $18,088 | $1,576,227 | $656,761 | $919,466 |
| 2020 | $17,950 | $1,560,065 | $650,027 | $910,038 |
| 2019 | $17,574 | $1,529,476 | $637,282 | $892,194 |
| 2018 | $17,378 | $1,499,486 | $624,786 | $874,700 |
| 2017 | $17,163 | $1,470,085 | $612,536 | $857,549 |
| 2016 | $16,202 | $1,441,259 | $600,525 | $840,734 |
| 2015 | $15,962 | $1,419,610 | $591,505 | $828,105 |
| 2014 | $15,795 | $1,391,802 | $579,918 | $811,884 |
Source: Public Records
Map
Nearby Homes
- 603 Mission St
- 514 Washington St
- 260 High St Unit 206
- 260 High St Unit 204
- 233 Rigg St
- 120 Maple St
- 1103 Mission St
- 807 Laurel St
- 1124 Laurel St
- 148 Myrtle St
- 2030 N Pacific Ave Unit 314
- 449 High St
- 350 Highland Ave
- 126 Cedar St
- 356 Everson Dr Unit 356
- 623 High St
- 102 Tree Frog Ln
- 116 Shelter Lagoon Dr
- 121 Acadia Ave
- 180 Dakota Ave Unit D
- 521 Chestnut St
- 519 Chestnut St
- 127 Rincon St
- 100 Pine Place
- 515 Chestnut St
- 520 Chestnut St
- 2800 Ranch Dr Unit 2
- 129 Rincon St
- 104 Pine Place
- 513 Chestnut St
- 511 Chestnut St
- 516 Chestnut St
- 335 Church St
- 135 Rincon St
- 139 Rincon St
- 122 Rincon St
- 304 Walnut Ave
- 310 Walnut Ave
- 314 Walnut Ave
- 128 Rincon St