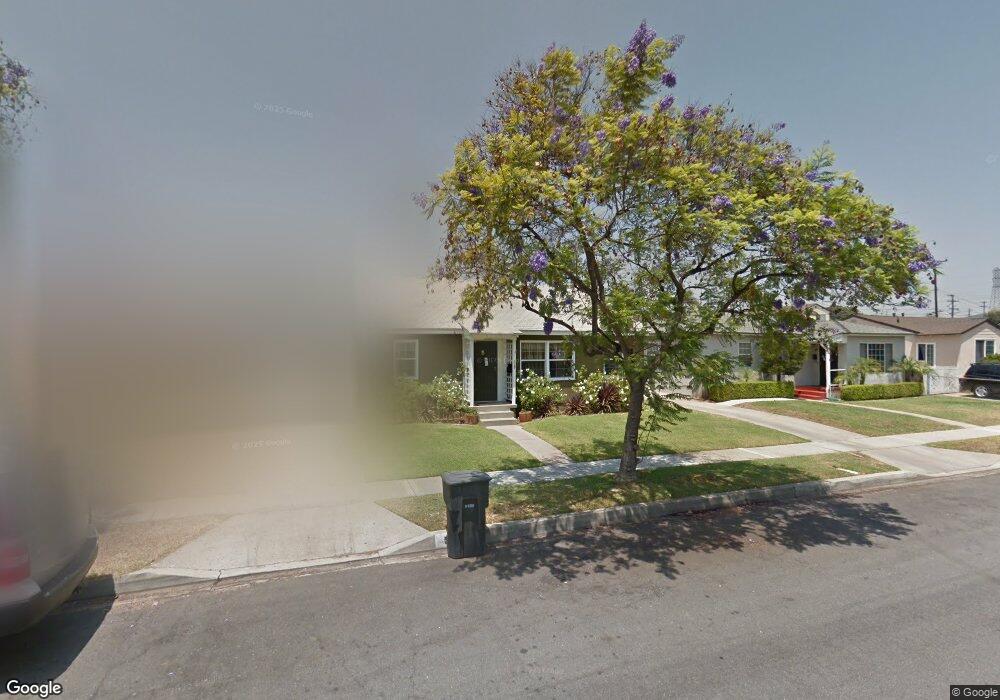
529 W Floral Dr Monterey Park, CA 91754
Estimated Value: $797,743 - $923,000
3
Beds
1
Bath
1,026
Sq Ft
$830/Sq Ft
Est. Value
About This Home
This home is located at 529 W Floral Dr, Monterey Park, CA 91754 and is currently estimated at $851,436, approximately $829 per square foot. 529 W Floral Dr is a home located in Los Angeles County with nearby schools including Bella Vista Elementary School, Macy Intermediate School, and Schurr High School.
Ownership History
Date
Name
Owned For
Owner Type
Purchase Details
Closed on
Nov 26, 2007
Sold by
Khuu Dia Tan
Bought by
Gonzalez Sergio and Infante Juana
Current Estimated Value
Home Financials for this Owner
Home Financials are based on the most recent Mortgage that was taken out on this home.
Original Mortgage
$391,065
Outstanding Balance
$248,295
Interest Rate
6.36%
Mortgage Type
Purchase Money Mortgage
Estimated Equity
$603,141
Purchase Details
Closed on
May 22, 2002
Sold by
Khuu Dia Tan
Bought by
Khuu Dia Tan and Phuong Nghi Tuyet
Purchase Details
Closed on
Jun 5, 1997
Sold by
Jao Raymond
Bought by
Khuu Dia Tan and Phuong Nghi Tuyet
Home Financials for this Owner
Home Financials are based on the most recent Mortgage that was taken out on this home.
Original Mortgage
$112,500
Interest Rate
7.91%
Create a Home Valuation Report for This Property
The Home Valuation Report is an in-depth analysis detailing your home's value as well as a comparison with similar homes in the area
Home Values in the Area
Average Home Value in this Area
Purchase History
| Date | Buyer | Sale Price | Title Company |
|---|---|---|---|
| Gonzalez Sergio | $435,000 | Ticor Title Company | |
| Khuu Dia Tan | -- | -- | |
| Khuu Dia Tan | $150,000 | Investors Title Company |
Source: Public Records
Mortgage History
| Date | Status | Borrower | Loan Amount |
|---|---|---|---|
| Open | Gonzalez Sergio | $391,065 | |
| Previous Owner | Khuu Dia Tan | $112,500 |
Source: Public Records
Tax History Compared to Growth
Tax History
| Year | Tax Paid | Tax Assessment Tax Assessment Total Assessment is a certain percentage of the fair market value that is determined by local assessors to be the total taxable value of land and additions on the property. | Land | Improvement |
|---|---|---|---|---|
| 2025 | $7,438 | $571,362 | $459,722 | $111,640 |
| 2024 | $7,438 | $560,159 | $450,708 | $109,451 |
| 2023 | $7,455 | $549,176 | $441,871 | $107,305 |
| 2022 | $7,200 | $538,408 | $433,207 | $105,201 |
| 2021 | $6,957 | $527,852 | $424,713 | $103,139 |
| 2019 | $6,685 | $512,198 | $412,117 | $100,081 |
| 2018 | $6,785 | $502,156 | $404,037 | $98,119 |
| 2016 | $6,487 | $482,659 | $388,349 | $94,310 |
| 2015 | $6,083 | $475,410 | $382,516 | $92,894 |
| 2014 | $5,105 | $394,000 | $317,000 | $77,000 |
Source: Public Records
Map
Nearby Homes
- 501 W Floral Dr
- 498 W Riggin St
- 413 W Riggin St
- 532 W Gleason St
- 3613 Via Campo
- 812 W Fernfield Dr
- 833 Findlay Ave
- 249 Simmons Ave
- 1701 S Mcpherrin Ave
- 1351 S Ynez Ave
- 109 E Hammel St
- 1800 Fernbank Ave
- 105 E Floral Dr
- 1301 S Atlantic Blvd Unit 234C
- 264 Margaret Ave
- 500 A S Garfield Unit A
- 1314 W 1st St
- 1240 S Ynez Ave
- 2012 S Garfield Ave
- 150 E Floral Dr
- 533 W Floral Dr
- 525 W Floral Dr
- 521 W Floral Dr
- 528 W Arlight St
- 537 W Floral Dr
- 532 W Arlight St
- 524 W Arlight St
- 520 W Arlight St
- 536 W Arlight St
- 517 W Floral Dr
- 528 W Floral Dr
- 524 W Floral Dr
- 532 W Floral Dr
- 520 W Floral Dr
- 536 W Floral Dr
- 513 W Floral Dr
- 601 W Floral Dr
- 516 W Floral Dr
- 512 W Arlight St
- 529 W Arlight St