53 Clark Rd Fiskdale, MA 01518
Estimated Value: $465,706 - $548,000
3
Beds
3
Baths
1,728
Sq Ft
$289/Sq Ft
Est. Value
About This Home
This home is located at 53 Clark Rd, Fiskdale, MA 01518 and is currently estimated at $499,927, approximately $289 per square foot. 53 Clark Rd is a home located in Worcester County with nearby schools including Burgess Elementary School, Tantasqua Regional Junior High School, and Tantasqua Regional High School.
Ownership History
Date
Name
Owned For
Owner Type
Purchase Details
Closed on
Feb 20, 2004
Sold by
Miller Catherine A and Miller John W
Bought by
Jones Patricia L and Jones Paul R
Current Estimated Value
Home Financials for this Owner
Home Financials are based on the most recent Mortgage that was taken out on this home.
Original Mortgage
$235,000
Outstanding Balance
$109,366
Interest Rate
5.83%
Mortgage Type
Purchase Money Mortgage
Estimated Equity
$390,561
Purchase Details
Closed on
Apr 29, 1999
Sold by
Wood Gary R and Wood Susan G
Bought by
Miller John W and Miller Catherine A
Home Financials for this Owner
Home Financials are based on the most recent Mortgage that was taken out on this home.
Original Mortgage
$174,997
Interest Rate
6.95%
Mortgage Type
Purchase Money Mortgage
Purchase Details
Closed on
Sep 28, 1994
Sold by
Cmg Dev Corp
Bought by
Wood Gary R and Wood Susan
Create a Home Valuation Report for This Property
The Home Valuation Report is an in-depth analysis detailing your home's value as well as a comparison with similar homes in the area
Home Values in the Area
Average Home Value in this Area
Purchase History
| Date | Buyer | Sale Price | Title Company |
|---|---|---|---|
| Jones Patricia L | $270,000 | -- | |
| Miller John W | $169,900 | -- | |
| Wood Gary R | $129,900 | -- |
Source: Public Records
Mortgage History
| Date | Status | Borrower | Loan Amount |
|---|---|---|---|
| Open | Jones Patricia L | $235,000 | |
| Previous Owner | Wood Gary R | $40,000 | |
| Previous Owner | Wood Gary R | $14,000 | |
| Previous Owner | Wood Gary R | $174,997 |
Source: Public Records
Tax History Compared to Growth
Tax History
| Year | Tax Paid | Tax Assessment Tax Assessment Total Assessment is a certain percentage of the fair market value that is determined by local assessors to be the total taxable value of land and additions on the property. | Land | Improvement |
|---|---|---|---|---|
| 2025 | $6,066 | $380,800 | $84,600 | $296,200 |
| 2024 | $5,953 | $361,000 | $82,900 | $278,100 |
| 2023 | $5,609 | $310,400 | $72,000 | $238,400 |
| 2022 | $5,395 | $281,700 | $65,000 | $216,700 |
| 2021 | $5,059 | $266,000 | $62,000 | $204,000 |
| 2020 | $5,059 | $266,000 | $62,000 | $204,000 |
| 2019 | $4,839 | $252,700 | $63,700 | $189,000 |
| 2018 | $4,634 | $238,400 | $60,600 | $177,800 |
| 2017 | $4,439 | $228,800 | $58,500 | $170,300 |
| 2016 | $4,366 | $227,300 | $56,700 | $170,600 |
| 2015 | $4,335 | $225,300 | $56,700 | $168,600 |
Source: Public Records
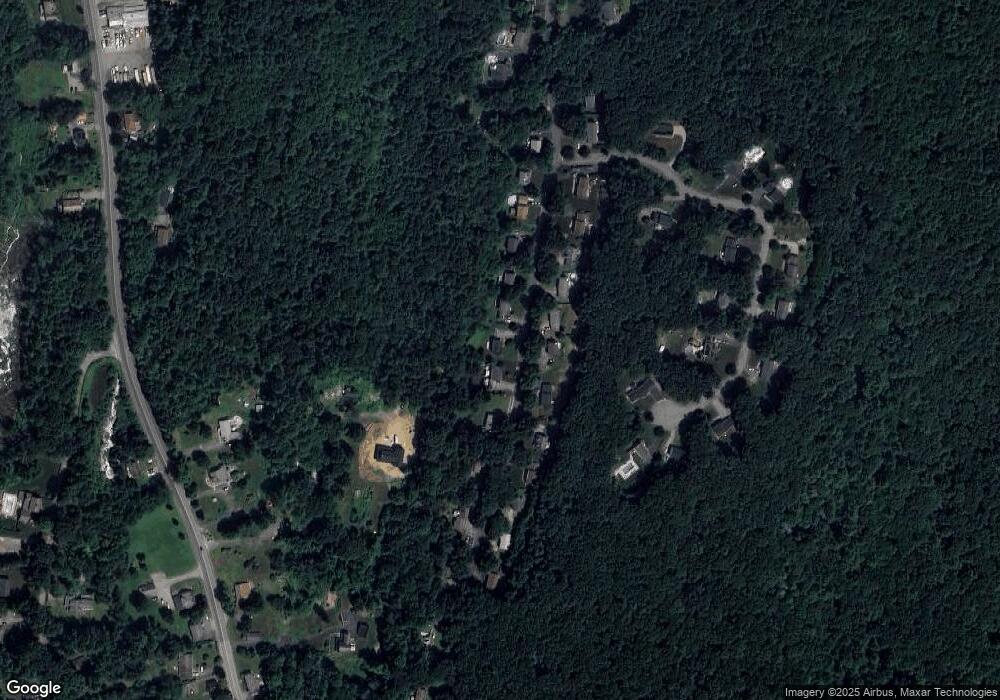
Map
Nearby Homes
- 537 Main St
- 5 Hinman St Unit 4
- 504 Main St
- 16 Summit Ave
- 314 The Trail
- 7 Crescent Way Unit 105
- 7 Crescent Way Unit 315
- 87 Holland Rd
- 146-A Cedar St
- 26 Cedar Lake Dr
- 51-A Seneca Ln
- 6 Cedar Pond Dr
- 43 Mountain Brook Rd
- 368 Main St
- 50 Beach Ave
- 73 New Boston Rd
- 54 Little Alum Rd
- 0 Five Bridge Rd
- 9 Haynes St
- 7 Haynes St