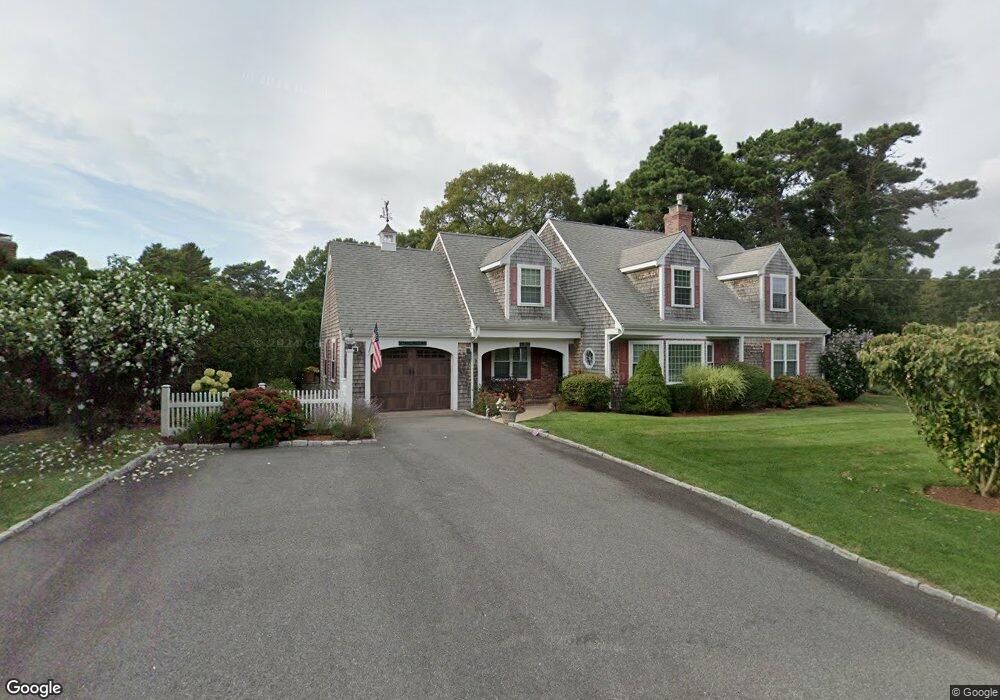
53 Golfers Cir South Yarmouth, MA 02664
Estimated Value: $724,162 - $828,000
2
Beds
2
Baths
1,001
Sq Ft
$782/Sq Ft
Est. Value
About This Home
This home is located at 53 Golfers Cir, South Yarmouth, MA 02664 and is currently estimated at $782,791, approximately $782 per square foot. 53 Golfers Cir is a home located in Barnstable County with nearby schools including Dennis-Yarmouth Regional High School and St. Pius X. School.
Ownership History
Date
Name
Owned For
Owner Type
Purchase Details
Closed on
Feb 1, 2007
Sold by
Bligh Hubert and Bligh Mary
Bought by
53 Golfers Circle Rt and Bligh Hubert
Current Estimated Value
Purchase Details
Closed on
Jun 26, 2002
Sold by
Treat Lillian C
Bought by
Bligh Hubert and Bligh Mary
Purchase Details
Closed on
Jul 14, 2000
Sold by
Allen Arnold B
Bought by
Treat Lillian C
Home Financials for this Owner
Home Financials are based on the most recent Mortgage that was taken out on this home.
Original Mortgage
$40,000
Interest Rate
8.1%
Create a Home Valuation Report for This Property
The Home Valuation Report is an in-depth analysis detailing your home's value as well as a comparison with similar homes in the area
Home Values in the Area
Average Home Value in this Area
Purchase History
| Date | Buyer | Sale Price | Title Company |
|---|---|---|---|
| 53 Golfers Circle Rt | -- | -- | |
| Bligh Hubert | $285,000 | -- | |
| Treat Lillian C | $188,000 | -- |
Source: Public Records
Mortgage History
| Date | Status | Borrower | Loan Amount |
|---|---|---|---|
| Previous Owner | Treat Lillian C | $40,312 | |
| Previous Owner | Treat Lillian C | $40,000 |
Source: Public Records
Tax History Compared to Growth
Tax History
| Year | Tax Paid | Tax Assessment Tax Assessment Total Assessment is a certain percentage of the fair market value that is determined by local assessors to be the total taxable value of land and additions on the property. | Land | Improvement |
|---|---|---|---|---|
| 2025 | $5,443 | $768,800 | $231,400 | $537,400 |
| 2024 | $5,043 | $683,400 | $201,300 | $482,100 |
| 2023 | $4,948 | $610,100 | $169,900 | $440,200 |
| 2022 | $4,448 | $484,500 | $152,100 | $332,400 |
| 2021 | $4,364 | $456,500 | $152,100 | $304,400 |
| 2020 | $4,173 | $417,300 | $149,600 | $267,700 |
| 2019 | $3,897 | $385,800 | $149,600 | $236,200 |
| 2018 | $3,879 | $377,000 | $140,800 | $236,200 |
| 2017 | $3,778 | $377,000 | $140,800 | $236,200 |
| 2016 | $3,762 | $377,000 | $140,800 | $236,200 |
| 2015 | $3,636 | $362,200 | $140,800 | $221,400 |
Source: Public Records
Map
Nearby Homes
- 91 Chipping Green Cir
- 85 Keel Cape Dr
- 21 Green Way
- 8 Viking Rock Rd
- 23 Fairwood Rd
- 30 Pebble Beach Way
- 18 Curve Hill Rd
- 1 Country Club Dr
- 37 Winsome Rd
- 140 Diane Ave
- 38 N Dennis Rd
- 176 Beacon St
- 4 Raymond Ave
- 2 Buttercup Ln
- 4 Old Colony Way
- 32 Half Way
- 17 Fairmount Rd
- 17 Fairmount Rd
- 62 Old Fish House Rd