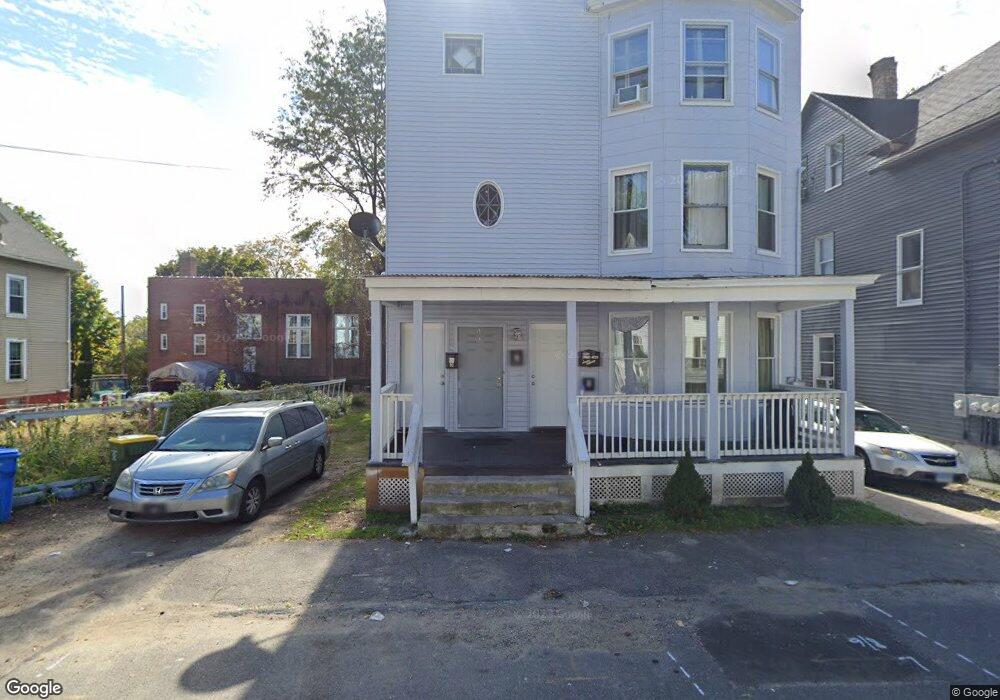
53 Hawkins St Waterbury, CT 06704
North End District NeighborhoodEstimated Value: $128,000 - $296,000
13
Beds
3
Baths
4,515
Sq Ft
$45/Sq Ft
Est. Value
About This Home
This home is located at 53 Hawkins St, Waterbury, CT 06704 and is currently estimated at $203,561, approximately $45 per square foot. 53 Hawkins St is a home located in New Haven County with nearby schools including F. J. Kingsbury School, North End Middle School, and Wilby High School.
Ownership History
Date
Name
Owned For
Owner Type
Purchase Details
Closed on
Sep 8, 2022
Sold by
Zhitnitsky Vladimer A and Zhitnitsky Vladimer
Bought by
Chima Carlos A and Minaya Silvia R
Current Estimated Value
Purchase Details
Closed on
Apr 11, 2012
Sold by
Flaws Jim
Bought by
Zhitnitsky Vladimir
Purchase Details
Closed on
Oct 20, 2008
Sold by
Jones Margaret B
Bought by
Flaws Jim and Zhitnitsky Vladimir A
Create a Home Valuation Report for This Property
The Home Valuation Report is an in-depth analysis detailing your home's value as well as a comparison with similar homes in the area
Home Values in the Area
Average Home Value in this Area
Purchase History
| Date | Buyer | Sale Price | Title Company |
|---|---|---|---|
| Chima Carlos A | $100,000 | None Available | |
| Zhitnitsky Vladimir | -- | -- | |
| Flaws Jim | $11,476 | -- |
Source: Public Records
Mortgage History
| Date | Status | Borrower | Loan Amount |
|---|---|---|---|
| Previous Owner | Flaws Jim | $625,000 |
Source: Public Records
Tax History Compared to Growth
Tax History
| Year | Tax Paid | Tax Assessment Tax Assessment Total Assessment is a certain percentage of the fair market value that is determined by local assessors to be the total taxable value of land and additions on the property. | Land | Improvement |
|---|---|---|---|---|
| 2025 | $4,754 | $105,700 | $6,860 | $98,840 |
| 2024 | $5,226 | $105,700 | $6,860 | $98,840 |
| 2023 | $5,728 | $105,700 | $6,860 | $98,840 |
| 2022 | $2,413 | $40,070 | $6,840 | $33,230 |
| 2021 | $2,413 | $40,070 | $6,840 | $33,230 |
| 2020 | $2,413 | $40,070 | $6,840 | $33,230 |
| 2019 | $2,413 | $40,070 | $6,840 | $33,230 |
| 2018 | $2,413 | $40,070 | $6,840 | $33,230 |
| 2017 | $2,443 | $40,580 | $6,830 | $33,750 |
| 2016 | $2,443 | $40,580 | $6,830 | $33,750 |
| 2015 | $2,363 | $40,580 | $6,830 | $33,750 |
| 2014 | $2,363 | $40,580 | $6,830 | $33,750 |
Source: Public Records
Map
Nearby Homes