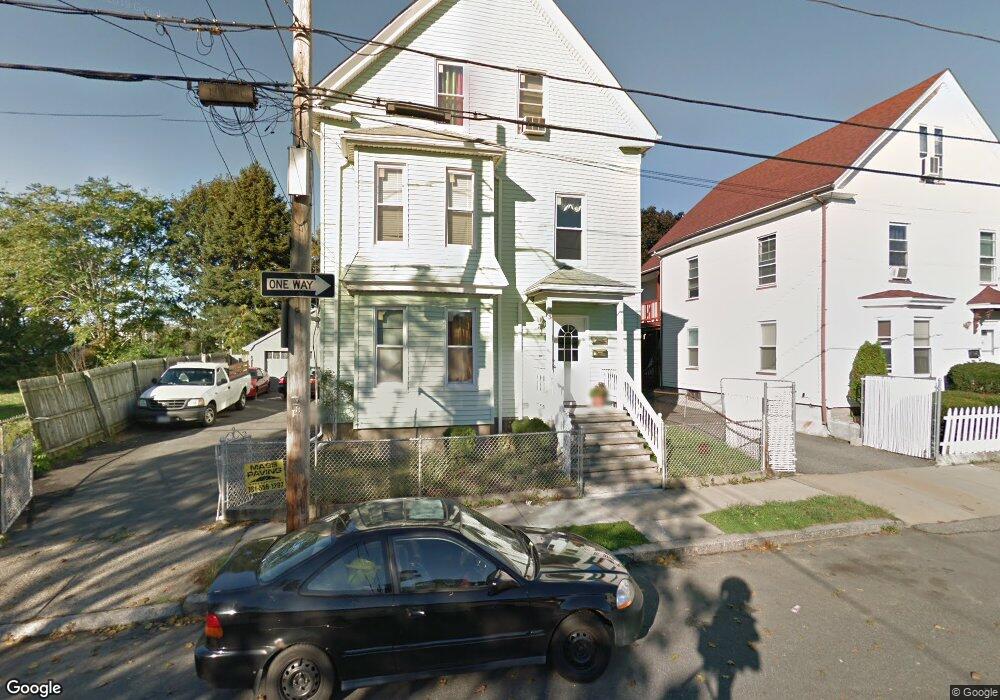
53 Linden St Lynn, MA 01905
West Lynn NeighborhoodEstimated Value: $661,000 - $828,000
7
Beds
2
Baths
2,584
Sq Ft
$290/Sq Ft
Est. Value
About This Home
This home is located at 53 Linden St, Lynn, MA 01905 and is currently estimated at $749,145, approximately $289 per square foot. 53 Linden St is a home located in Essex County with nearby schools including North Park Elementary School, Drewicz Elementary School, and William R. Fallon School.
Ownership History
Date
Name
Owned For
Owner Type
Purchase Details
Closed on
Dec 31, 2004
Sold by
Castillo Juan S and Castillo Tony W
Bought by
Sandoval Angela
Current Estimated Value
Home Financials for this Owner
Home Financials are based on the most recent Mortgage that was taken out on this home.
Original Mortgage
$304,400
Outstanding Balance
$153,483
Interest Rate
5.73%
Mortgage Type
Purchase Money Mortgage
Estimated Equity
$595,662
Purchase Details
Closed on
Apr 12, 1995
Sold by
Es Milaszewski Stanley and Milaszewski Stella
Bought by
Castillo Juan S and Castillo Tony
Create a Home Valuation Report for This Property
The Home Valuation Report is an in-depth analysis detailing your home's value as well as a comparison with similar homes in the area
Home Values in the Area
Average Home Value in this Area
Purchase History
| Date | Buyer | Sale Price | Title Company |
|---|---|---|---|
| Sandoval Angela | $380,500 | -- | |
| Castillo Juan S | $95,000 | -- |
Source: Public Records
Mortgage History
| Date | Status | Borrower | Loan Amount |
|---|---|---|---|
| Open | Castillo Juan S | $304,400 | |
| Closed | Castillo Juan S | $76,100 | |
| Previous Owner | Castillo Juan S | $217,000 |
Source: Public Records
Tax History Compared to Growth
Tax History
| Year | Tax Paid | Tax Assessment Tax Assessment Total Assessment is a certain percentage of the fair market value that is determined by local assessors to be the total taxable value of land and additions on the property. | Land | Improvement |
|---|---|---|---|---|
| 2025 | $7,750 | $748,107 | $204,700 | $543,407 |
| 2024 | $7,285 | $691,800 | $188,100 | $503,700 |
| 2023 | $7,097 | $636,500 | $167,500 | $469,000 |
| 2022 | $7,378 | $593,600 | $157,400 | $436,200 |
| 2021 | $6,769 | $519,500 | $129,900 | $389,600 |
| 2020 | $6,112 | $456,100 | $108,500 | $347,600 |
| 2019 | $5,807 | $406,100 | $93,200 | $312,900 |
| 2018 | $5,563 | $367,200 | $101,900 | $265,300 |
| 2017 | $5,293 | $339,300 | $90,100 | $249,200 |
| 2016 | $4,961 | $306,600 | $85,300 | $221,300 |
| 2015 | $4,539 | $271,000 | $73,500 | $197,500 |
Source: Public Records
Map
Nearby Homes
- 16 Linden St
- 45 Cottage St Unit 3
- 86 Laurel St
- 16 River St Unit 6
- 79 Laurel St
- 3 River Street Ct
- 28 Margin St Unit A
- 9 Needhams Landing
- 19 Hood St
- 20 Murray St
- 100 Ashland St
- 14 River Street Place
- 8 Ray St
- 28 Wyman St
- 505-507 Boston St
- 93 South St
- 27 S Street Ct
- 15 Neptune Street Ct
- 92-94 Newton Ave
- 35 Curran Rd