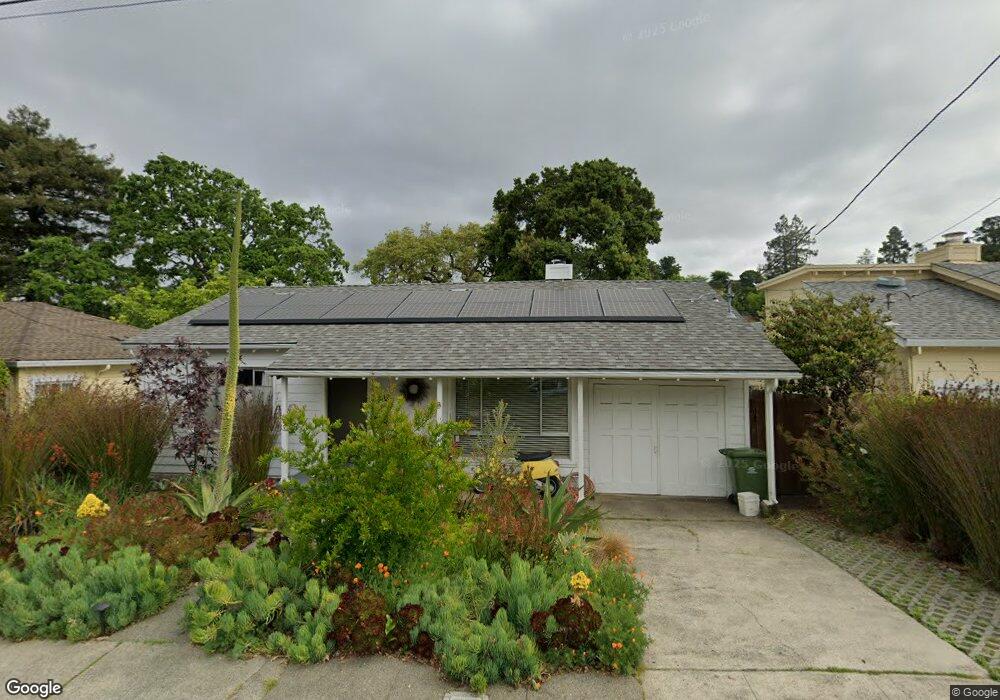
53 Meadow Ave San Rafael, CA 94901
Picnic Valley NeighborhoodEstimated Value: $722,000 - $941,000
2
Beds
1
Bath
892
Sq Ft
$969/Sq Ft
Est. Value
About This Home
This home is located at 53 Meadow Ave, San Rafael, CA 94901 and is currently estimated at $864,654, approximately $969 per square foot. 53 Meadow Ave is a home located in Marin County with nearby schools including Laurel Dell Elementary School, Coleman Elementary School, and James B. Davidson Middle School.
Ownership History
Date
Name
Owned For
Owner Type
Purchase Details
Closed on
Jul 6, 2015
Sold by
Rivera Ronald P and Rivera Lynne L
Bought by
Rivera Elizabeth
Current Estimated Value
Purchase Details
Closed on
Sep 25, 2013
Sold by
Hayes Dennis J and Hayes Belinda H
Bought by
Rivera Ronald P and Rivera Lynne L
Purchase Details
Closed on
Aug 25, 2011
Sold by
Hayes James F and Hayes James F
Bought by
Hayes James F and James F Hayes Survivors Trust
Purchase Details
Closed on
Dec 18, 2008
Sold by
Hayes Dennis J
Bought by
Hayes Dennis J and Hayes Belinda H
Purchase Details
Closed on
Nov 5, 2008
Sold by
Hayes Dennis J and Hayes James F
Bought by
Hayes Dennis J and Hayes James F
Purchase Details
Closed on
Aug 14, 2008
Sold by
Hayes James F
Bought by
Hayes James F and Hayes Karen A
Purchase Details
Closed on
Jun 11, 1999
Sold by
Hayes Bernice M
Bought by
Hayes Bernice M and Bernice M Hayes Inter Vivos Tr
Create a Home Valuation Report for This Property
The Home Valuation Report is an in-depth analysis detailing your home's value as well as a comparison with similar homes in the area
Home Values in the Area
Average Home Value in this Area
Purchase History
| Date | Buyer | Sale Price | Title Company |
|---|---|---|---|
| Rivera Elizabeth | -- | None Available | |
| Rivera Ronald P | $489,000 | Old Republic Title Company | |
| Hayes James F | -- | None Available | |
| Hayes Dennis J | -- | None Available | |
| Hayes Dennis J | -- | None Available | |
| Hayes James F | -- | None Available | |
| Hayes Bernice M | -- | -- |
Source: Public Records
Tax History Compared to Growth
Tax History
| Year | Tax Paid | Tax Assessment Tax Assessment Total Assessment is a certain percentage of the fair market value that is determined by local assessors to be the total taxable value of land and additions on the property. | Land | Improvement |
|---|---|---|---|---|
| 2025 | $9,082 | $599,421 | $367,743 | $231,678 |
| 2024 | $9,082 | $587,670 | $360,534 | $227,136 |
| 2023 | $8,890 | $576,149 | $353,466 | $222,683 |
| 2022 | $8,434 | $564,853 | $346,536 | $218,317 |
| 2021 | $8,302 | $553,782 | $339,744 | $214,038 |
| 2020 | $8,197 | $548,105 | $336,261 | $211,844 |
| 2019 | $7,947 | $537,362 | $329,670 | $207,692 |
| 2018 | $7,866 | $526,829 | $323,208 | $203,621 |
| 2017 | $7,581 | $516,501 | $316,872 | $199,629 |
| 2016 | $7,319 | $506,374 | $310,659 | $195,715 |
| 2015 | $6,998 | $498,770 | $305,994 | $192,776 |
| 2014 | -- | $489,000 | $300,000 | $189,000 |
Source: Public Records
Map
Nearby Homes
- 4 Meadow Ave
- 10 Hazel Ct
- 148 Auburn St
- 150 Bungalow Ave
- 142 Bungalow Ave
- 19 Mliss Ln
- 321 N Almenar Dr
- 124 Tiburon Blvd
- 215 Picnic Ave
- 370 Via la Cumbre
- 81 Corte Gracitas
- 490 Canal St Unit 6
- 56 Mooring Rd Unit 2
- 4 Point San Pedro Rd Unit 4
- 2 Alvina Ave
- 236 C St
- 102 Marina Court Dr
- 207 D St
- 35 Fairfax St Unit 8
- 21 Marina Blvd