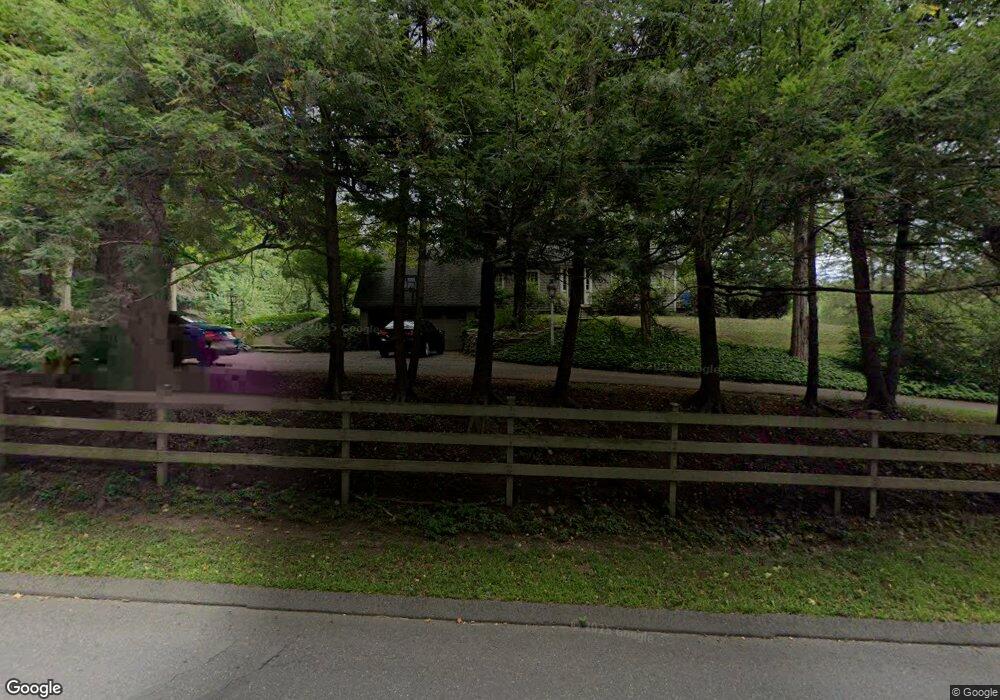
53 White Deer Rocks Rd Woodbury, CT 06798
Estimated Value: $836,000 - $1,075,000
5
Beds
3
Baths
3,303
Sq Ft
$274/Sq Ft
Est. Value
About This Home
This home is located at 53 White Deer Rocks Rd, Woodbury, CT 06798 and is currently estimated at $903,820, approximately $273 per square foot. 53 White Deer Rocks Rd is a home located in Litchfield County with nearby schools including Mitchell Elementary School, Bethlehem Elementary School, and Woodbury Middle School.
Ownership History
Date
Name
Owned For
Owner Type
Purchase Details
Closed on
Aug 1, 2023
Sold by
Rapaglia Karin
Bought by
Rapaglia Stephan A and Rapaglia Meg M
Current Estimated Value
Purchase Details
Closed on
Jan 14, 2023
Sold by
Mccormick John M and Mccormick Patricia
Bought by
Rapaglia Stephan A and Rapaglia Meg M
Purchase Details
Closed on
May 1, 1997
Sold by
Titcomb Paul and Titcomb Karen
Bought by
Krueger Thomas and Krueger Marian
Home Financials for this Owner
Home Financials are based on the most recent Mortgage that was taken out on this home.
Original Mortgage
$180,000
Interest Rate
7.85%
Mortgage Type
Purchase Money Mortgage
Create a Home Valuation Report for This Property
The Home Valuation Report is an in-depth analysis detailing your home's value as well as a comparison with similar homes in the area
Home Values in the Area
Average Home Value in this Area
Purchase History
| Date | Buyer | Sale Price | Title Company |
|---|---|---|---|
| Rapaglia Stephan A | -- | None Available | |
| Rapaglia Stephan A | -- | None Available | |
| Krueger Thomas | $350,000 | -- |
Source: Public Records
Mortgage History
| Date | Status | Borrower | Loan Amount |
|---|---|---|---|
| Previous Owner | Krueger Thomas | $130,600 | |
| Previous Owner | Krueger Thomas | $180,000 | |
| Previous Owner | Krueger Thomas | $239,500 | |
| Previous Owner | Krueger Thomas | $112,000 |
Source: Public Records
Tax History Compared to Growth
Tax History
| Year | Tax Paid | Tax Assessment Tax Assessment Total Assessment is a certain percentage of the fair market value that is determined by local assessors to be the total taxable value of land and additions on the property. | Land | Improvement |
|---|---|---|---|---|
| 2025 | $11,450 | $484,750 | $131,320 | $353,430 |
| 2024 | $10,969 | $473,410 | $131,320 | $342,090 |
| 2023 | $10,449 | $359,560 | $131,320 | $228,240 |
| 2022 | $10,488 | $359,560 | $131,320 | $228,240 |
| 2021 | $8,915 | $359,560 | $131,320 | $228,240 |
| 2020 | $10,488 | $359,560 | $131,320 | $228,240 |
| 2019 | $6,215 | $359,560 | $131,320 | $228,240 |
| 2018 | $8,832 | $390,080 | $147,590 | $242,490 |
| 2017 | $14,961 | $390,080 | $147,590 | $242,490 |
| 2016 | $10,255 | $390,080 | $147,590 | $242,490 |
| 2015 | $10,169 | $390,080 | $147,590 | $242,490 |
| 2014 | $10,021 | $390,080 | $147,590 | $242,490 |
Source: Public Records
Map
Nearby Homes
- 70 Mountain Rd
- 54 Mountain Rd
- 18 Woodbury Hill
- 74 Washington Rd Unit 16
- 2 Linden Rd
- 92 Minortown Rd
- 105 Minortown Rd
- 509 Main St N
- 337 Main St S
- 229 Bacon Pond Rd Unit 454
- 523 Main St N
- 148 Flanders Rd
- 393 Middle Road Turnpike
- 74 Middle Quarter Rd
- 437 Middle Road Turnpike
- 225 Old Sherman Hill Rd
- 819 Main St N
- 9 Hill View Ln
- 34 Transylvania Rd
- 101 Plumb Brook Rd
- 52 White Deer Rocks Rd
- 55 White Deer Rocks Rd
- 64 White Deer Rocks Rd Unit 7G
- 64 White Deer Rocks Rd Unit 6F
- 64 White Deer Rocks Rd Unit 3C
- 64 White Deer Rocks Rd Unit 4D
- 64 White Deer Rocks Rd Unit 2B, 4D
- 64 White Deer Rocks Rd Unit 2B
- 64 White Deer Rocks Rd
- 64 White Deer Rocks Rd Unit C
- 64 White Deer Rocks Rd Unit 1A
- 33 White Deer Rocks Rd
- 118 Middle Road Turnpike
- 118 Middle Turnpike
- 114 Middle Road Turnpike
- 28 White Deer Rocks Rd
- 35 Ash Swamp Rd
- 20 White Deer Rocks Rd
- 76 Middle Road Turnpike
- 00 Bacon Pond Rd