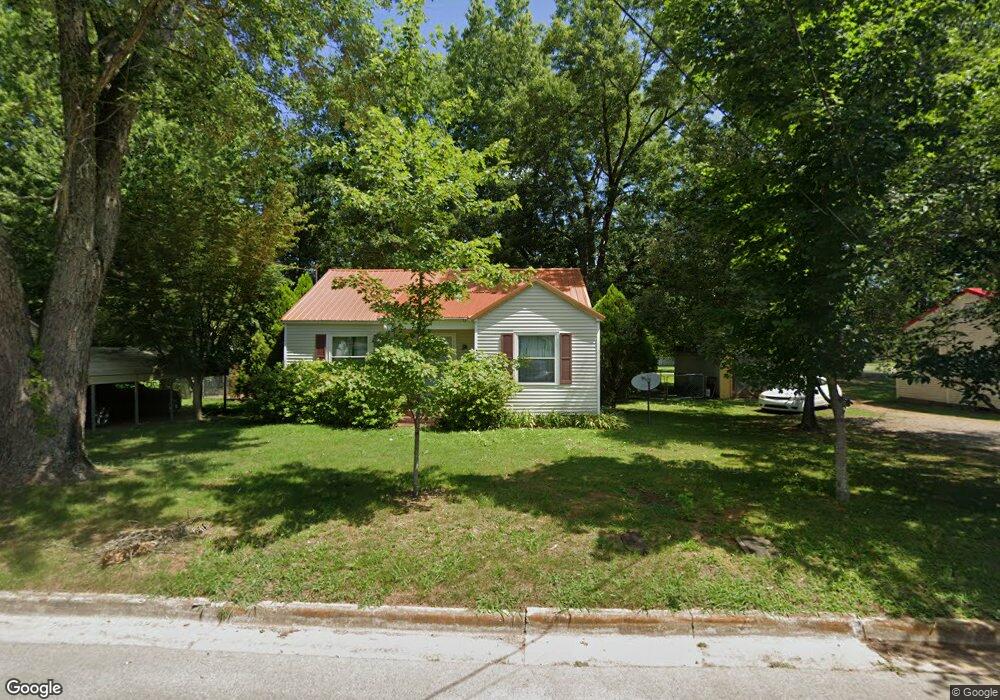
530 2nd St Lawrenceburg, TN 38464
Estimated Value: $100,753 - $177,000
--
Bed
1
Bath
1,039
Sq Ft
$129/Sq Ft
Est. Value
About This Home
This home is located at 530 2nd St, Lawrenceburg, TN 38464 and is currently estimated at $134,438, approximately $129 per square foot. 530 2nd St is a home located in Lawrence County with nearby schools including Ingram Sowell Elementary School, Lawrenceburg Public Elementary School, and David Crockett Elementary School.
Ownership History
Date
Name
Owned For
Owner Type
Purchase Details
Closed on
May 14, 2019
Sold by
Moore Doris Nell
Bought by
Moore Christopher C
Current Estimated Value
Purchase Details
Closed on
Nov 19, 2002
Sold by
Bobby King
Bought by
Moore Grover D and Moore Doris N
Home Financials for this Owner
Home Financials are based on the most recent Mortgage that was taken out on this home.
Original Mortgage
$30,000
Interest Rate
6.15%
Purchase Details
Closed on
Dec 6, 2000
Sold by
Clark Emmett V
Bought by
Bobby King
Purchase Details
Closed on
Jan 17, 1948
Bought by
Clark Emmett Veto and Clark Sylvia
Create a Home Valuation Report for This Property
The Home Valuation Report is an in-depth analysis detailing your home's value as well as a comparison with similar homes in the area
Home Values in the Area
Average Home Value in this Area
Purchase History
| Date | Buyer | Sale Price | Title Company |
|---|---|---|---|
| Moore Christopher C | -- | None Available | |
| Moore Grover D | $40,000 | -- | |
| Bobby King | $35,000 | -- | |
| Clark Emmett Veto | -- | -- |
Source: Public Records
Mortgage History
| Date | Status | Borrower | Loan Amount |
|---|---|---|---|
| Closed | Clark Emmett Veto | $30,000 |
Source: Public Records
Tax History Compared to Growth
Tax History
| Year | Tax Paid | Tax Assessment Tax Assessment Total Assessment is a certain percentage of the fair market value that is determined by local assessors to be the total taxable value of land and additions on the property. | Land | Improvement |
|---|---|---|---|---|
| 2025 | $558 | $17,950 | $0 | $0 |
| 2024 | $558 | $17,950 | $2,000 | $15,950 |
| 2023 | $558 | $17,950 | $2,000 | $15,950 |
| 2022 | $558 | $17,950 | $2,000 | $15,950 |
| 2021 | $412 | $9,375 | $2,000 | $7,375 |
| 2020 | $412 | $9,375 | $2,000 | $7,375 |
| 2019 | $412 | $9,375 | $2,000 | $7,375 |
| 2018 | $412 | $9,375 | $2,000 | $7,375 |
| 2017 | $412 | $9,375 | $2,000 | $7,375 |
| 2016 | $412 | $9,375 | $2,000 | $7,375 |
| 2015 | $390 | $9,375 | $2,000 | $7,375 |
| 2014 | $391 | $9,400 | $2,000 | $7,400 |
Source: Public Records
Map
Nearby Homes