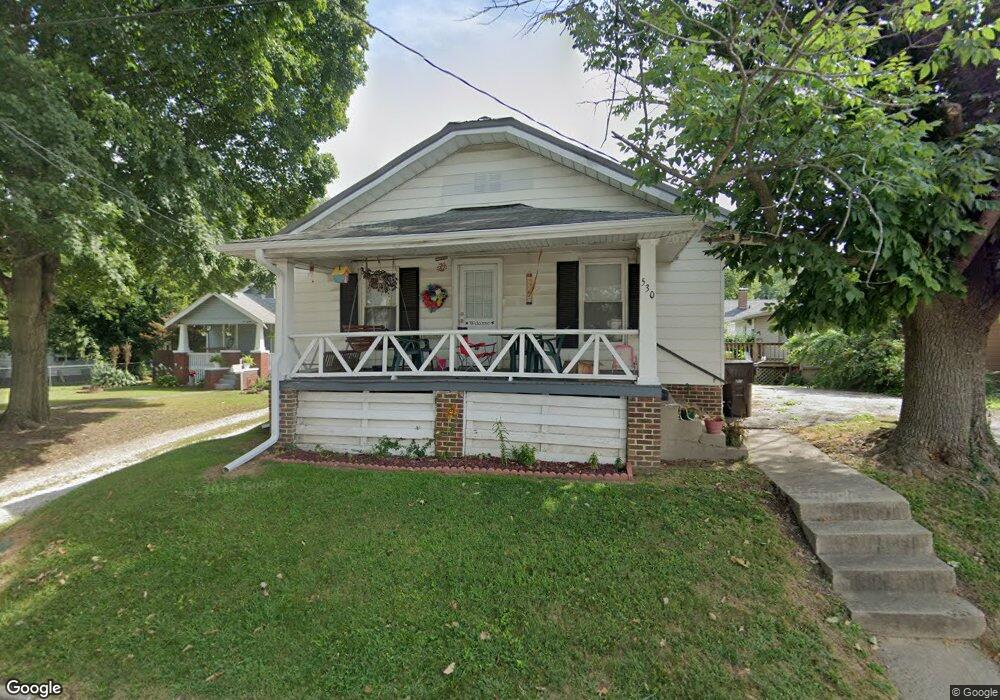
530 S Mauvaisterre St Jacksonville, IL 62650
Estimated Value: $52,012 - $69,000
2
Beds
1
Bath
896
Sq Ft
$68/Sq Ft
Est. Value
About This Home
This home is located at 530 S Mauvaisterre St, Jacksonville, IL 62650 and is currently estimated at $61,253, approximately $68 per square foot. 530 S Mauvaisterre St is a home located in Morgan County with nearby schools including Jacksonville High School, Salem Lutheran School, and Salem Lutheran School.
Ownership History
Date
Name
Owned For
Owner Type
Purchase Details
Closed on
Jun 29, 2022
Sold by
Cnh Properties Llc
Bought by
Lee Brooke Properties Llc
Current Estimated Value
Purchase Details
Closed on
May 31, 2012
Sold by
Davidsmeyer Chad A and Davidsmeyer Heather K
Bought by
Cnh Properties Llc
Home Financials for this Owner
Home Financials are based on the most recent Mortgage that was taken out on this home.
Original Mortgage
$25,600
Interest Rate
3.9%
Mortgage Type
Purchase Money Mortgage
Purchase Details
Closed on
Dec 8, 2008
Sold by
Applbaum Marshall S
Bought by
Davidsmeyer Chad
Home Financials for this Owner
Home Financials are based on the most recent Mortgage that was taken out on this home.
Original Mortgage
$25,857
Interest Rate
6.49%
Mortgage Type
Purchase Money Mortgage
Purchase Details
Closed on
Apr 4, 2002
Sold by
Kirbach Matthew
Bought by
Reynolds Ii Harry H
Create a Home Valuation Report for This Property
The Home Valuation Report is an in-depth analysis detailing your home's value as well as a comparison with similar homes in the area
Home Values in the Area
Average Home Value in this Area
Purchase History
| Date | Buyer | Sale Price | Title Company |
|---|---|---|---|
| Lee Brooke Properties Llc | $36,000 | None Listed On Document | |
| Cnh Properties Llc | -- | None Available | |
| Davidsmeyer Chad | $20,000 | None Available | |
| Reynolds Ii Harry H | $35,500 | -- |
Source: Public Records
Mortgage History
| Date | Status | Borrower | Loan Amount |
|---|---|---|---|
| Previous Owner | Cnh Properties Llc | $25,600 | |
| Previous Owner | Davidsmeyer Chad | $25,857 |
Source: Public Records
Tax History Compared to Growth
Tax History
| Year | Tax Paid | Tax Assessment Tax Assessment Total Assessment is a certain percentage of the fair market value that is determined by local assessors to be the total taxable value of land and additions on the property. | Land | Improvement |
|---|---|---|---|---|
| 2024 | $979 | $11,250 | $550 | $10,700 |
| 2023 | $993 | $10,530 | $550 | $9,980 |
| 2022 | $1,083 | $11,370 | $550 | $10,820 |
| 2021 | $781 | $8,370 | $660 | $7,710 |
| 2020 | $797 | $8,370 | $660 | $7,710 |
| 2019 | $792 | $8,370 | $660 | $7,710 |
| 2018 | $763 | $8,370 | $660 | $7,710 |
| 2017 | $783 | $8,780 | $660 | $8,120 |
| 2016 | $791 | $8,780 | $660 | $8,120 |
| 2015 | $781 | $8,520 | $640 | $7,880 |
| 2014 | $781 | $8,520 | $640 | $7,880 |
| 2013 | $736 | $8,520 | $640 | $7,880 |
Source: Public Records
Map
Nearby Homes
- 800 S Main St
- 333 Kentucky St
- 352 Franklin St
- 227 Anna St
- 440 S Sandy St
- 209 E Beecher Ave
- 401 S East St
- 406 S East St
- 900 Bibbs St
- 203 W Beecher Ave
- 544 Hardin Ave
- None None St
- 727 Hardin Ave
- 216 S Church St
- 507 S Prairie St
- 400 W Morgan St
- 506 S Diamond St
- 314 W Douglas Ave
- 839 Grove St
- 356 E Lafayette Ave
- 204 Franklin Dr
- 202 Franklin Dr
- 520 S Mauvaisterre St
- 206 Franklin Dr
- 208 Franklin St
- 208 Franklin Dr
- 510 S Mauvaisterre St
- 203 Franklin Dr
- 207 Franklin Dr
- 220 Franklin Dr
- 604 S Main St
- 517 S Mauvaisterre St
- 200 E Chambers St
- 213 Franklin Dr
- 208 E Chambers St
- 523 S East St
- 608 S Main St
- 521 S East St
- 518 S Main St
- 519 S East St