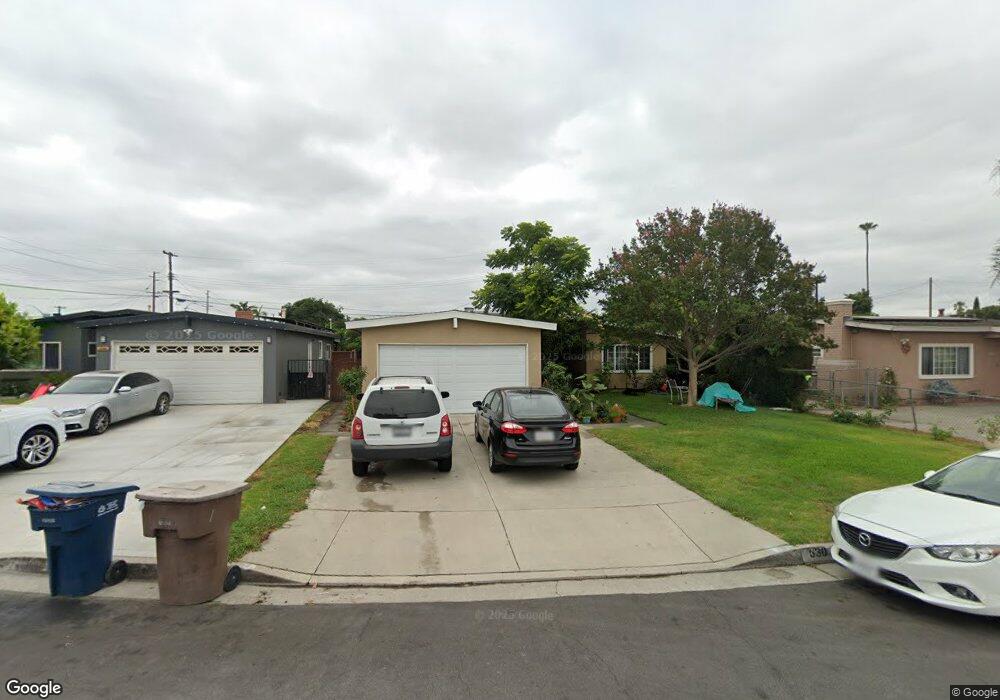
530 Sandia Ave La Puente, CA 91746
Estimated Value: $745,000 - $846,000
4
Beds
2
Baths
1,257
Sq Ft
$624/Sq Ft
Est. Value
About This Home
This home is located at 530 Sandia Ave, La Puente, CA 91746 and is currently estimated at $784,075, approximately $623 per square foot. 530 Sandia Ave is a home located in Los Angeles County with nearby schools including Lassalette Middle School, La Puente High School, and St. Louis of France School.
Ownership History
Date
Name
Owned For
Owner Type
Purchase Details
Closed on
Nov 22, 1996
Sold by
Ainley Alfred and The Ainley Family Trust
Bought by
Armas Francisco J and Armas April A
Current Estimated Value
Home Financials for this Owner
Home Financials are based on the most recent Mortgage that was taken out on this home.
Original Mortgage
$143,252
Outstanding Balance
$13,708
Interest Rate
7.76%
Mortgage Type
FHA
Estimated Equity
$770,367
Purchase Details
Closed on
Mar 2, 1995
Sold by
Ainely Alfred and Ainley Honora
Bought by
Ainley Alfred and Ainley Honora
Purchase Details
Closed on
Oct 29, 1993
Sold by
Ainley Alfred and Ainley Hondra Helen
Bought by
Ainley Alfred and Ainley Honora Helen
Home Financials for this Owner
Home Financials are based on the most recent Mortgage that was taken out on this home.
Original Mortgage
$3,000
Interest Rate
6.97%
Create a Home Valuation Report for This Property
The Home Valuation Report is an in-depth analysis detailing your home's value as well as a comparison with similar homes in the area
Home Values in the Area
Average Home Value in this Area
Purchase History
| Date | Buyer | Sale Price | Title Company |
|---|---|---|---|
| Armas Francisco J | $146,000 | North American Title Co | |
| Ainley Alfred | -- | -- | |
| Ainley Alfred | -- | Chicago Title |
Source: Public Records
Mortgage History
| Date | Status | Borrower | Loan Amount |
|---|---|---|---|
| Open | Armas Francisco J | $143,252 | |
| Previous Owner | Ainley Alfred | $3,000 |
Source: Public Records
Tax History Compared to Growth
Tax History
| Year | Tax Paid | Tax Assessment Tax Assessment Total Assessment is a certain percentage of the fair market value that is determined by local assessors to be the total taxable value of land and additions on the property. | Land | Improvement |
|---|---|---|---|---|
| 2025 | $3,529 | $266,019 | $104,380 | $161,639 |
| 2024 | $3,529 | $260,804 | $102,334 | $158,470 |
| 2023 | $3,441 | $255,691 | $100,328 | $155,363 |
| 2022 | $3,344 | $250,678 | $98,361 | $152,317 |
| 2021 | $3,282 | $245,764 | $96,433 | $149,331 |
| 2019 | $3,190 | $238,476 | $93,574 | $144,902 |
| 2018 | $3,065 | $233,801 | $91,740 | $142,061 |
| 2016 | $2,920 | $224,725 | $88,179 | $136,546 |
| 2015 | $2,868 | $221,350 | $86,855 | $134,495 |
| 2014 | $2,828 | $217,015 | $85,154 | $131,861 |
Source: Public Records
Map
Nearby Homes
- 544 N Orange Ave Unit B
- 433 Sunkist Ave
- 610 Willow Ave
- 452 Willow Ave
- 736 Tonopah Ave
- 14421 Flynn St
- 13903 Moccasin St
- 335 Willow Ave
- 14612 Hutchcroft St
- 14510 Amar Rd Unit J
- 932 Shadydale Ave
- 750 Glenshaw Dr
- 979 Willow Ave Unit 31
- 943 Willow Ave
- 13622 Hartsville St
- 822 Greenberry Dr
- 227 S 4th Ave
- 14940 Beckner St
- 320 S 5th Ave
- 829 Foxworth Ave
- 524 Sandia Ave
- 520 Sandia Ave
- 542 Sandia Ave
- 547 N Orange Ave
- 555 N Orange Ave
- 543 N Orange Ave
- 514 Sandia Ave
- 531 Sandia Ave
- 559 N Orange Ave
- 537 N Orange Ave
- 537 Sandia Ave
- 525 Sandia Ave
- 543 Sandia Ave
- 519 Sandia Ave
- 531 N Orange Ave
- 513 Sandia Ave
- 602 Sandia Ave
- 14255 Beckner St
- 14267 Beckner St
- 530 Sandsprings Dr