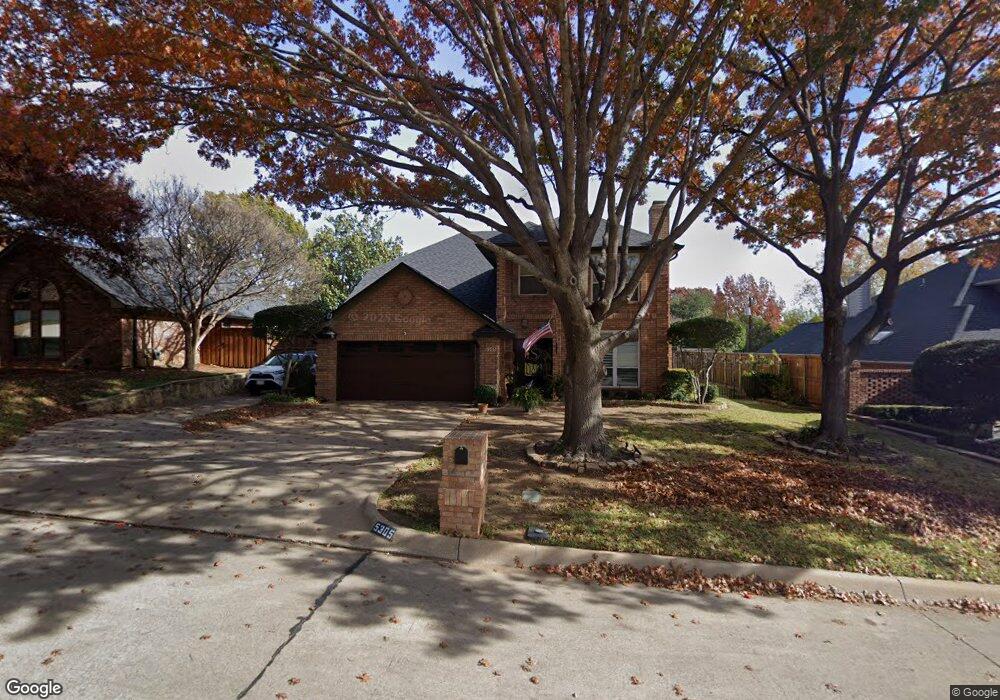
5305 Bugle Ln Colleyville, TX 76034
Estimated Value: $573,622 - $651,000
4
Beds
3
Baths
2,706
Sq Ft
$230/Sq Ft
Est. Value
About This Home
This home is located at 5305 Bugle Ln, Colleyville, TX 76034 and is currently estimated at $622,406, approximately $230 per square foot. 5305 Bugle Ln is a home located in Tarrant County with nearby schools including Heritage Elementary School, Heritage Middle School, and Holy Trinity Catholic School.
Ownership History
Date
Name
Owned For
Owner Type
Purchase Details
Closed on
Mar 14, 2005
Sold by
Merchant Kristi K and Merchant Kristi Ann
Bought by
Sutter William M and Sutter Kimberly K
Current Estimated Value
Home Financials for this Owner
Home Financials are based on the most recent Mortgage that was taken out on this home.
Original Mortgage
$180,000
Outstanding Balance
$91,557
Interest Rate
5.66%
Mortgage Type
Purchase Money Mortgage
Estimated Equity
$530,849
Purchase Details
Closed on
Jan 8, 2001
Sold by
Merchant Larry William
Bought by
Merchant Kristi Ann
Home Financials for this Owner
Home Financials are based on the most recent Mortgage that was taken out on this home.
Original Mortgage
$146,600
Interest Rate
7.55%
Mortgage Type
Seller Take Back
Purchase Details
Closed on
Dec 11, 1996
Sold by
Prudential Residential Svcs Ltd Prtnrshp
Bought by
Merchant Larry and Merchant Kristi K
Home Financials for this Owner
Home Financials are based on the most recent Mortgage that was taken out on this home.
Original Mortgage
$146,600
Interest Rate
7.6%
Create a Home Valuation Report for This Property
The Home Valuation Report is an in-depth analysis detailing your home's value as well as a comparison with similar homes in the area
Home Values in the Area
Average Home Value in this Area
Purchase History
| Date | Buyer | Sale Price | Title Company |
|---|---|---|---|
| Sutter William M | -- | Alamo Title Company | |
| Merchant Kristi Ann | -- | -- | |
| Merchant Larry | -- | Stewart Title |
Source: Public Records
Mortgage History
| Date | Status | Borrower | Loan Amount |
|---|---|---|---|
| Open | Sutter William M | $180,000 | |
| Previous Owner | Merchant Kristi Ann | $146,600 | |
| Previous Owner | Merchant Larry | $146,600 |
Source: Public Records
Tax History Compared to Growth
Tax History
| Year | Tax Paid | Tax Assessment Tax Assessment Total Assessment is a certain percentage of the fair market value that is determined by local assessors to be the total taxable value of land and additions on the property. | Land | Improvement |
|---|---|---|---|---|
| 2025 | $1,825 | $430,373 | $114,050 | $316,323 |
| 2024 | $1,825 | $448,305 | $114,050 | $334,255 |
| 2023 | $7,237 | $466,801 | $114,050 | $352,751 |
| 2022 | $7,703 | $390,000 | $114,050 | $275,950 |
| 2021 | $8,565 | $390,000 | $68,430 | $321,570 |
| 2020 | $8,666 | $390,000 | $68,430 | $321,570 |
| 2019 | $8,786 | $380,000 | $80,000 | $300,000 |
| 2018 | $2,148 | $361,354 | $80,000 | $281,354 |
| 2017 | $7,778 | $349,478 | $70,000 | $279,478 |
| 2016 | $7,071 | $332,962 | $70,000 | $262,962 |
| 2015 | $6,108 | $272,100 | $30,000 | $242,100 |
| 2014 | $6,108 | $272,100 | $30,000 | $242,100 |
Source: Public Records
Map
Nearby Homes
- 3278 Birch Ave
- 3321 Circlewood Ct
- 5134 Post Oak Trail
- 3712 Bur Oak Dr
- 3701 Post Oak Trail
- 3110 Fox Run Dr
- 4282 Hearthside Dr
- 3329 Moss Creek Dr
- 4213 Hearthside Dr
- 4214 Hearthside Dr
- 3908 Heritage Oaks Dr
- 2906 Edgewood Ln
- 3301 Queensbury Way W
- 2906 Cottonwood Ln
- 3712 Rothschild Blvd
- 3705 Rothschild Blvd
- 3933 Blackjack Oak Dr
- 3409 Crossgate Cir N
- 2704 Yorkshire Ct
- 4105 Williams Ct
- 5303 Bugle Ln
- 5307 Bugle Ln
- 3408 Fox Glen Dr
- 5301 Bugle Ln
- 3402 Fox Glen Dr
- 3403 Fox Meadows Dr
- 5304 Bugle Ln
- 3410 Fox Glen Dr
- 3405 Fox Meadows Dr
- 5302 Bugle Ln
- 3407 Fox Glen Dr
- 3405 Fox Glen Dr
- 3400 Fox Glen Dr
- 3409 Fox Glen Dr
- 3403 Fox Glen Dr
- 3500 Fox Glen Dr
- 5300 Bugle Ln
- 5207 Bugle Ln
- 3501 Fox Meadows Dr
- 3411 Fox Glen Dr