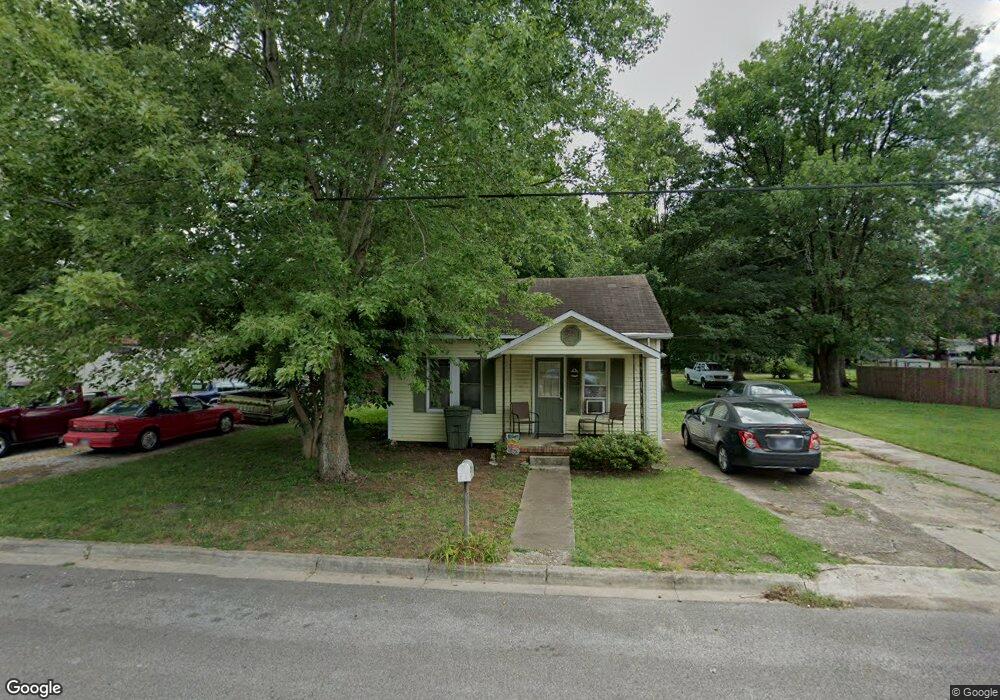
531 6th St Lawrenceburg, TN 38464
Estimated Value: $60,000 - $82,879
--
Bed
1
Bath
768
Sq Ft
$88/Sq Ft
Est. Value
About This Home
This home is located at 531 6th St, Lawrenceburg, TN 38464 and is currently estimated at $67,220, approximately $87 per square foot. 531 6th St is a home located in Lawrence County with nearby schools including Ingram Sowell Elementary School, Lawrenceburg Public Elementary School, and David Crockett Elementary School.
Ownership History
Date
Name
Owned For
Owner Type
Purchase Details
Closed on
Aug 8, 2025
Sold by
Lawson Charlotte D
Bought by
Escobar Eli and Escobar Kimberly
Current Estimated Value
Purchase Details
Closed on
Nov 26, 2007
Sold by
William Toungett
Bought by
Lawson Charlotte D
Home Financials for this Owner
Home Financials are based on the most recent Mortgage that was taken out on this home.
Original Mortgage
$29,900
Interest Rate
6.29%
Purchase Details
Closed on
Jun 26, 2003
Sold by
Bobby Morgan
Bought by
William Toungett
Purchase Details
Closed on
Apr 22, 1997
Sold by
Columbus Kilburn
Bought by
Bobby Morgan
Home Financials for this Owner
Home Financials are based on the most recent Mortgage that was taken out on this home.
Original Mortgage
$12,100
Interest Rate
7.95%
Purchase Details
Closed on
Apr 23, 1985
Bought by
Kilburn Columbus and Kilburn Wanda
Purchase Details
Closed on
Jan 1, 1982
Purchase Details
Closed on
Jan 1, 1981
Create a Home Valuation Report for This Property
The Home Valuation Report is an in-depth analysis detailing your home's value as well as a comparison with similar homes in the area
Home Values in the Area
Average Home Value in this Area
Purchase History
| Date | Buyer | Sale Price | Title Company |
|---|---|---|---|
| Escobar Eli | $60,000 | Provident Title | |
| Escobar Eli | $60,000 | Provident Title | |
| Lawson Charlotte D | $29,900 | -- | |
| William Toungett | $17,000 | -- | |
| Bobby Morgan | $20,000 | -- | |
| Kilburn Columbus | -- | -- | |
| -- | $4,400 | -- | |
| -- | $10,000 | -- |
Source: Public Records
Mortgage History
| Date | Status | Borrower | Loan Amount |
|---|---|---|---|
| Previous Owner | Not Available | $29,900 | |
| Previous Owner | Not Available | $12,100 |
Source: Public Records
Tax History Compared to Growth
Tax History
| Year | Tax Paid | Tax Assessment Tax Assessment Total Assessment is a certain percentage of the fair market value that is determined by local assessors to be the total taxable value of land and additions on the property. | Land | Improvement |
|---|---|---|---|---|
| 2025 | $391 | $12,600 | $0 | $0 |
| 2024 | $391 | $12,600 | $1,500 | $11,100 |
| 2023 | $391 | $12,600 | $1,500 | $11,100 |
| 2022 | $391 | $12,600 | $1,500 | $11,100 |
| 2021 | $323 | $7,350 | $1,500 | $5,850 |
| 2020 | $323 | $7,350 | $1,500 | $5,850 |
| 2019 | $323 | $7,350 | $1,500 | $5,850 |
| 2018 | $323 | $7,350 | $1,500 | $5,850 |
| 2017 | $323 | $7,350 | $1,500 | $5,850 |
| 2016 | $323 | $7,350 | $1,500 | $5,850 |
| 2015 | $306 | $7,350 | $1,500 | $5,850 |
| 2014 | $303 | $7,275 | $1,500 | $5,775 |
Source: Public Records
Map
Nearby Homes