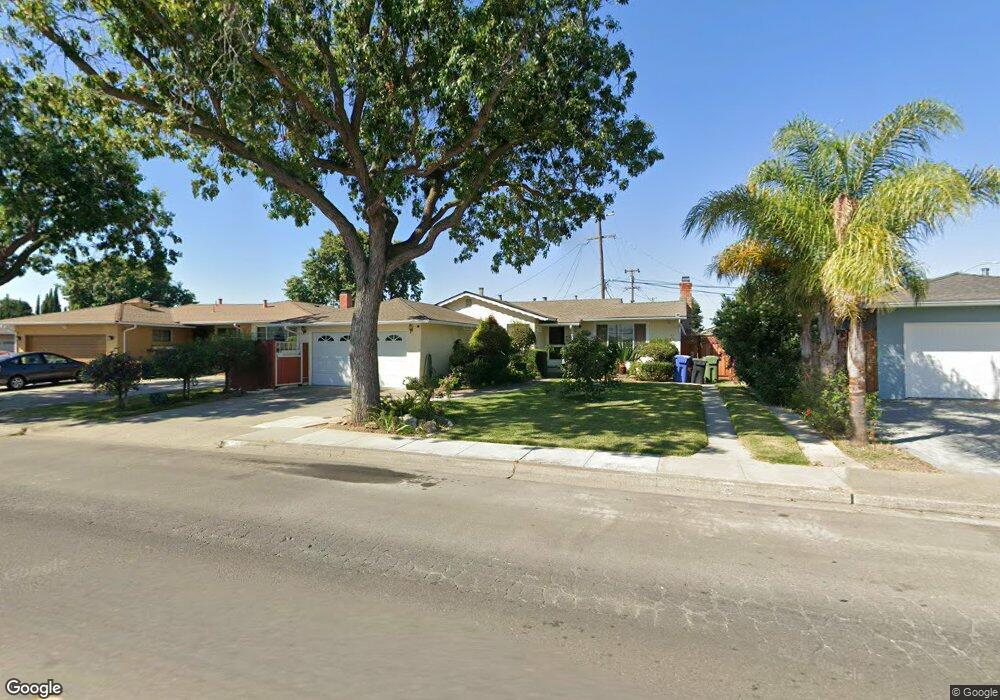
531 N Abbott Ave Milpitas, CA 95035
Estimated Value: $1,254,000 - $1,346,799
3
Beds
1
Bath
980
Sq Ft
$1,340/Sq Ft
Est. Value
About This Home
This home is located at 531 N Abbott Ave, Milpitas, CA 95035 and is currently estimated at $1,313,200, approximately $1,340 per square foot. 531 N Abbott Ave is a home located in Santa Clara County with nearby schools including Anthony Spangler Elementary School, Thomas Russell Middle School, and Milpitas High School.
Ownership History
Date
Name
Owned For
Owner Type
Purchase Details
Closed on
Apr 13, 2023
Sold by
Dominguez Samuel M and Dominguez Valeria
Bought by
2023 Dominguez Family Trust and Dominguez
Current Estimated Value
Purchase Details
Closed on
Nov 8, 2004
Sold by
Dominguez Samuel M and Dominguez Valeria
Bought by
Dominguez Samuel M and Dominguez Valeria
Home Financials for this Owner
Home Financials are based on the most recent Mortgage that was taken out on this home.
Original Mortgage
$355,000
Interest Rate
3.94%
Mortgage Type
New Conventional
Purchase Details
Closed on
Jun 8, 2000
Sold by
Walker Diane S and Walker Robert A
Bought by
Dominguez Samuel and Dominguez Valeria
Home Financials for this Owner
Home Financials are based on the most recent Mortgage that was taken out on this home.
Original Mortgage
$272,000
Interest Rate
8.27%
Purchase Details
Closed on
Sep 26, 1995
Sold by
Brown Joseph R and Brown Kathryn A
Bought by
Walker Robert A and Walker Diane S
Create a Home Valuation Report for This Property
The Home Valuation Report is an in-depth analysis detailing your home's value as well as a comparison with similar homes in the area
Home Values in the Area
Average Home Value in this Area
Purchase History
| Date | Buyer | Sale Price | Title Company |
|---|---|---|---|
| 2023 Dominguez Family Trust | -- | None Listed On Document | |
| Dominguez Samuel M | -- | None Listed On Document | |
| Dominguez Samuel M | -- | Alliance Title Company | |
| Dominguez Samuel | $340,000 | Alliance Title Company | |
| Walker Robert A | -- | -- |
Source: Public Records
Mortgage History
| Date | Status | Borrower | Loan Amount |
|---|---|---|---|
| Previous Owner | Dominguez Samuel M | $355,000 | |
| Previous Owner | Dominguez Samuel | $272,000 | |
| Closed | Dominguez Samuel | $34,000 |
Source: Public Records
Tax History Compared to Growth
Tax History
| Year | Tax Paid | Tax Assessment Tax Assessment Total Assessment is a certain percentage of the fair market value that is determined by local assessors to be the total taxable value of land and additions on the property. | Land | Improvement |
|---|---|---|---|---|
| 2025 | $6,125 | $522,545 | $235,144 | $287,401 |
| 2024 | $6,125 | $512,300 | $230,534 | $281,766 |
| 2023 | $6,106 | $502,256 | $226,014 | $276,242 |
| 2022 | $6,083 | $492,409 | $221,583 | $270,826 |
| 2021 | $5,995 | $482,755 | $217,239 | $265,516 |
| 2020 | $5,892 | $477,806 | $215,012 | $262,794 |
| 2019 | $5,827 | $468,439 | $210,797 | $257,642 |
| 2018 | $5,538 | $459,255 | $206,664 | $252,591 |
| 2017 | $5,467 | $450,251 | $202,612 | $247,639 |
| 2016 | $5,245 | $441,424 | $198,640 | $242,784 |
| 2015 | $5,193 | $434,795 | $195,657 | $239,138 |
| 2014 | $5,048 | $426,279 | $191,825 | $234,454 |
Source: Public Records
Map
Nearby Homes
- 559 Walnut Dr
- 479 Chestnut Ave
- 468 Glenmoor Cir
- 386 Heath St
- 207 Redwood Ave
- 1048 N Abbott Ave
- 1087 N Abbott Ave
- 1200 N Abbott Ave Unit 200
- 7280 Marylinn Dr
- 7 Crystal Ct
- 0 Railroad Ave
- 1206 California Cir
- 99 Jacklin Ct
- 1375 California Cir
- 1377 California Cir
- 1361 Lilac Way
- 1355 Lilac Way
- 50 Serra Way
- 284 Rio Verde Place Unit 3
- 392 Terra Mesa Way
- 547 N Abbott Ave
- 513 N Abbott Ave
- 444 Willow Ave
- 443 Elm Ave
- 456 Willow Ave
- 455 Elm Ave
- 522 N Abbott Ave
- 536 N Abbott Ave
- 548 N Abbott Ave
- 561 N Abbott Ave
- 506 N Abbott Ave
- 428 Elm Ave
- 468 Willow Ave
- 467 Elm Ave
- 447 Willow Ave
- 420 Elm Ave
- 560 N Abbott Ave
- 498 N Abbott Ave
- 459 Willow Ave
- 577 N Abbott Ave