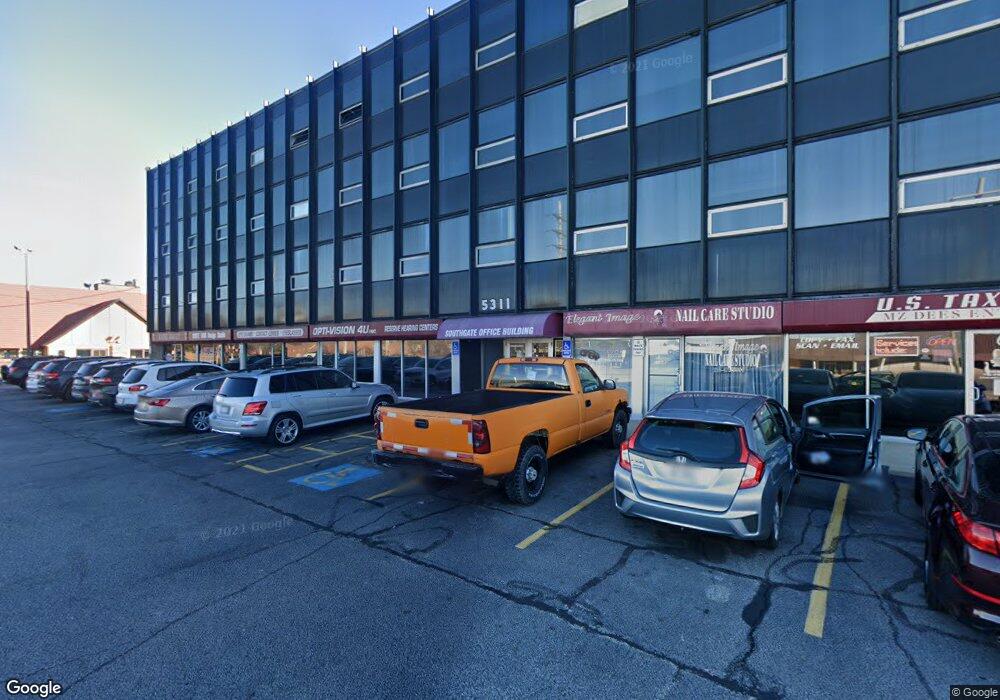
5311 Northfield Rd Unit 415 Bedford Heights, OH 44146
Estimated Value: $970,313
--
Bed
--
Bath
39,600
Sq Ft
$25/Sq Ft
Est. Value
About This Home
This home is located at 5311 Northfield Rd Unit 415, Bedford Heights, OH 44146 and is currently estimated at $970,313, approximately $24 per square foot. 5311 Northfield Rd Unit 415 is a home located in Cuyahoga County with nearby schools including Heskett Middle School, Bedford High School, and Ohio College Preparatory School.
Ownership History
Date
Name
Owned For
Owner Type
Purchase Details
Closed on
Dec 7, 2016
Sold by
Vfc Properties 23 Llc
Bought by
K And S Llc
Current Estimated Value
Purchase Details
Closed on
May 31, 2013
Sold by
Southgate Business Center Llc
Bought by
Vfc Properties 23 Llc
Purchase Details
Closed on
Jul 31, 2006
Sold by
Continental Land & Building Mgmt Co Llc
Bought by
Southgate Business Center Llc
Home Financials for this Owner
Home Financials are based on the most recent Mortgage that was taken out on this home.
Original Mortgage
$1,395,000
Interest Rate
6.82%
Mortgage Type
Construction
Purchase Details
Closed on
Sep 1, 2004
Sold by
Hershman Eugene
Bought by
Continental Land & Building Management C
Purchase Details
Closed on
Jun 22, 1992
Bought by
Hershman Eugene
Purchase Details
Closed on
Jan 1, 1975
Bought by
Kohrman S Lee Tr
Create a Home Valuation Report for This Property
The Home Valuation Report is an in-depth analysis detailing your home's value as well as a comparison with similar homes in the area
Home Values in the Area
Average Home Value in this Area
Purchase History
| Date | Buyer | Sale Price | Title Company |
|---|---|---|---|
| K And S Llc | $510,000 | Old Republic Title | |
| Vfc Properties 23 Llc | -- | Attorney | |
| Southgate Business Center Llc | $1,860,000 | Continental Title Agency | |
| Continental Land & Building Management C | -- | -- | |
| Hershman Eugene | -- | -- | |
| Kohrman S Lee Tr | -- | -- |
Source: Public Records
Mortgage History
| Date | Status | Borrower | Loan Amount |
|---|---|---|---|
| Previous Owner | Southgate Business Center Llc | $1,395,000 |
Source: Public Records
Tax History Compared to Growth
Tax History
| Year | Tax Paid | Tax Assessment Tax Assessment Total Assessment is a certain percentage of the fair market value that is determined by local assessors to be the total taxable value of land and additions on the property. | Land | Improvement |
|---|---|---|---|---|
| 2024 | $22,053 | $223,475 | $85,925 | $137,550 |
| 2023 | $21,341 | $205,280 | $98,810 | $106,470 |
| 2022 | $19,272 | $205,280 | $98,810 | $106,470 |
| 2021 | $19,223 | $205,280 | $98,810 | $106,470 |
| 2020 | $17,965 | $178,500 | $85,930 | $92,580 |
| 2019 | $17,630 | $510,000 | $245,500 | $264,500 |
| 2018 | $18,660 | $190,540 | $85,930 | $104,620 |
| 2017 | $44,439 | $433,340 | $61,880 | $371,460 |
| 2016 | $45,551 | $433,340 | $61,880 | $371,460 |
| 2015 | $44,105 | $433,340 | $61,880 | $371,460 |
| 2014 | -- | $481,500 | $68,740 | $412,760 |
Source: Public Records
Map
Nearby Homes
- 21416 Gardenview Dr
- 5301 Mardale Ave
- 5285 Mardale Ave
- 20750 Bowling Green Rd
- 20732 Applegate Rd
- 20739 Donny Brook Rd
- 20814 Kenyon Dr
- 20701 Kenyon Dr
- 21207 Franklin Rd
- 5385 Bartlett Rd
- 20510 Mountville Dr
- 21102 Raymond St
- 20625 Centuryway Rd
- 20814 Watson Rd
- 20107 Libby Rd
- 20907 Watson Rd
- 20715 Watson Rd
- 179 Willard Ave
- 19812 Stockton Ave
- 19806 Mountville Dr
- 5311 Northfield Rd Unit 401
- 5311 Northfield Rd Unit 419
- 5311 Northfield Rd Unit 216
- 5327 Northfield Rd
- 5327 Northfield Rd
- 5297 Northfield Rd
- 5291 Northfield Rd
- 5305 Northfield Rd
- 5305 Northfield Rd
- Lot 6 Libby Rd
- 5370 Holly Rd
- 21860 Libby Rd
- 5380 Holly Rd
- 21821 Libby Rd
- 22050 Marberry Commons
- 21831 Libby Rd
- 5363 Holly Rd
- 21607 Libby Rd
- 22052 Marberry Commons
- 5396 Holly Rd