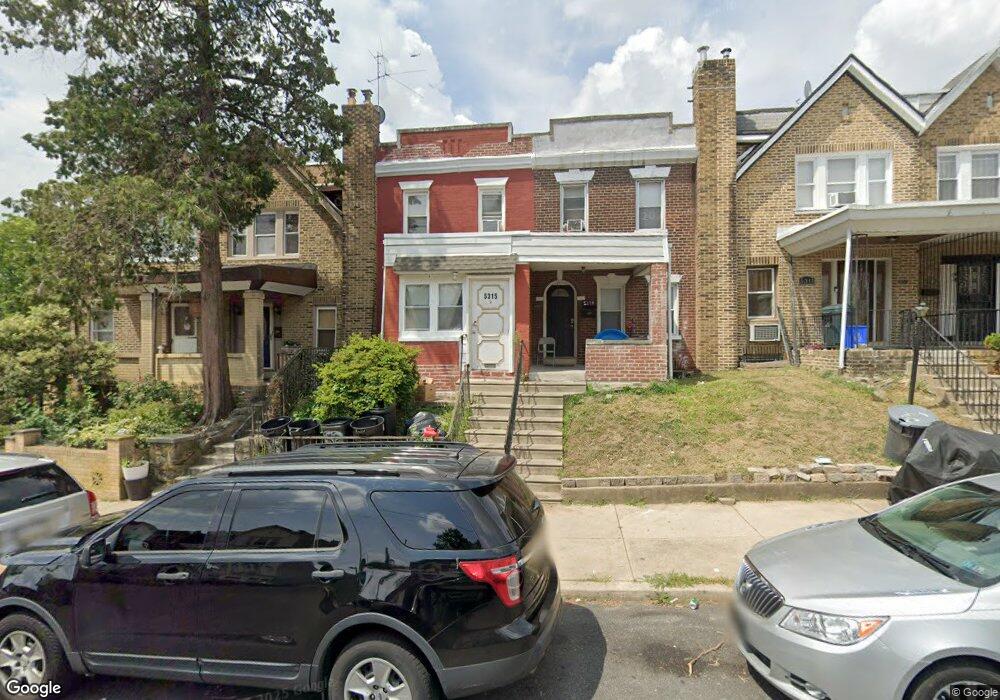
5315 W Oxford St Philadelphia, PA 19131
Wynnefield NeighborhoodEstimated Value: $141,000 - $237,000
3
Beds
1
Bath
1,152
Sq Ft
$166/Sq Ft
Est. Value
About This Home
This home is located at 5315 W Oxford St, Philadelphia, PA 19131 and is currently estimated at $191,064, approximately $165 per square foot. 5315 W Oxford St is a home located in Philadelphia County with nearby schools including Rudolph Blankenburg School, Overbrook High School, and Mastery Charter School Mann Elementary.
Ownership History
Date
Name
Owned For
Owner Type
Purchase Details
Closed on
Sep 29, 2021
Sold by
Marina Friedman
Bought by
Friedman Marina and Friedman Leonard E
Current Estimated Value
Home Financials for this Owner
Home Financials are based on the most recent Mortgage that was taken out on this home.
Original Mortgage
$112,500
Interest Rate
2.8%
Mortgage Type
New Conventional
Purchase Details
Closed on
Oct 15, 2008
Sold by
East Rentals Llc
Bought by
Friedman Marina
Purchase Details
Closed on
Sep 26, 2008
Sold by
Deutsche Bank National Trust Co
Bought by
East Rentals Llc
Purchase Details
Closed on
Nov 19, 2007
Sold by
Adams Regina
Bought by
Deutsche Bank National Trust Co and Pooling & Servicing Agreement Series Itf
Purchase Details
Closed on
Jan 22, 2002
Sold by
Daniels Bruce W and Unknown Heirs Of Doris Elizabe
Bought by
Berean Fsb
Create a Home Valuation Report for This Property
The Home Valuation Report is an in-depth analysis detailing your home's value as well as a comparison with similar homes in the area
Home Values in the Area
Average Home Value in this Area
Purchase History
| Date | Buyer | Sale Price | Title Company |
|---|---|---|---|
| Friedman Marina | -- | None Listed On Document | |
| Friedman Marina | $35,000 | None Available | |
| East Rentals Llc | $28,500 | None Available | |
| Deutsche Bank National Trust Co | $7,800 | None Available | |
| Berean Fsb | $6,500 | -- |
Source: Public Records
Mortgage History
| Date | Status | Borrower | Loan Amount |
|---|---|---|---|
| Previous Owner | Friedman Marina | $112,500 |
Source: Public Records
Tax History Compared to Growth
Tax History
| Year | Tax Paid | Tax Assessment Tax Assessment Total Assessment is a certain percentage of the fair market value that is determined by local assessors to be the total taxable value of land and additions on the property. | Land | Improvement |
|---|---|---|---|---|
| 2025 | $1,613 | $155,400 | $31,080 | $124,320 |
| 2024 | $1,613 | $155,400 | $31,080 | $124,320 |
| 2023 | $1,613 | $115,200 | $23,000 | $92,200 |
| 2022 | $1,205 | $115,200 | $23,000 | $92,200 |
| 2021 | $1,205 | $0 | $0 | $0 |
| 2020 | $1,205 | $0 | $0 | $0 |
| 2019 | $882 | $0 | $0 | $0 |
| 2018 | $882 | $0 | $0 | $0 |
| 2017 | $882 | $0 | $0 | $0 |
| 2016 | $882 | $0 | $0 | $0 |
| 2015 | $844 | $0 | $0 | $0 |
| 2014 | -- | $63,000 | $8,970 | $54,030 |
| 2012 | -- | $10,560 | $1,833 | $8,727 |
Source: Public Records
Map
Nearby Homes
- 5340 W Oxford St
- 5328 W Columbia Ave
- 5338 W Columbia Ave
- 1741 Georges Ln
- 1430 N 54th St
- 1735 N Peach St
- 1723 N 53rd St
- 1722 N Aberdeen St
- 1757 N Peach St
- 5389 Hazelhurst St
- 1711 N Lindenwood St
- 5257 W Jefferson St
- 5347 W Montgomery Ave
- 5400 W Montgomery Ave
- 1711 N Wilton St
- 5351 Morse St
- 1677 N Wilton St
- 1822 N 52nd St
- 5224 W Jefferson St
- 5448 W Montgomery Ave
- 5313 W Oxford St
- 5317 W Oxford St
- 5311 W Oxford St
- 5319 W Oxford St
- 5309 W Oxford St
- 5321 W Oxford St
- 5318 Turner St
- 5323 W Oxford St
- 5316 Turner St
- 5314 W Columbia Ave
- 5314 Turner St
- 5316 W Columbia Ave
- 5312 W Columbia Ave
- 5318 W Columbia Ave
- 5325 W Oxford St
- 5320 W Columbia Ave
- 5320 Turner St
- 5322 W Columbia Ave
- 5324 W Columbia Ave
- 5327 W Oxford St