Estimated Value: $251,819 - $281,000
3
Beds
2
Baths
1,138
Sq Ft
$230/Sq Ft
Est. Value
About This Home
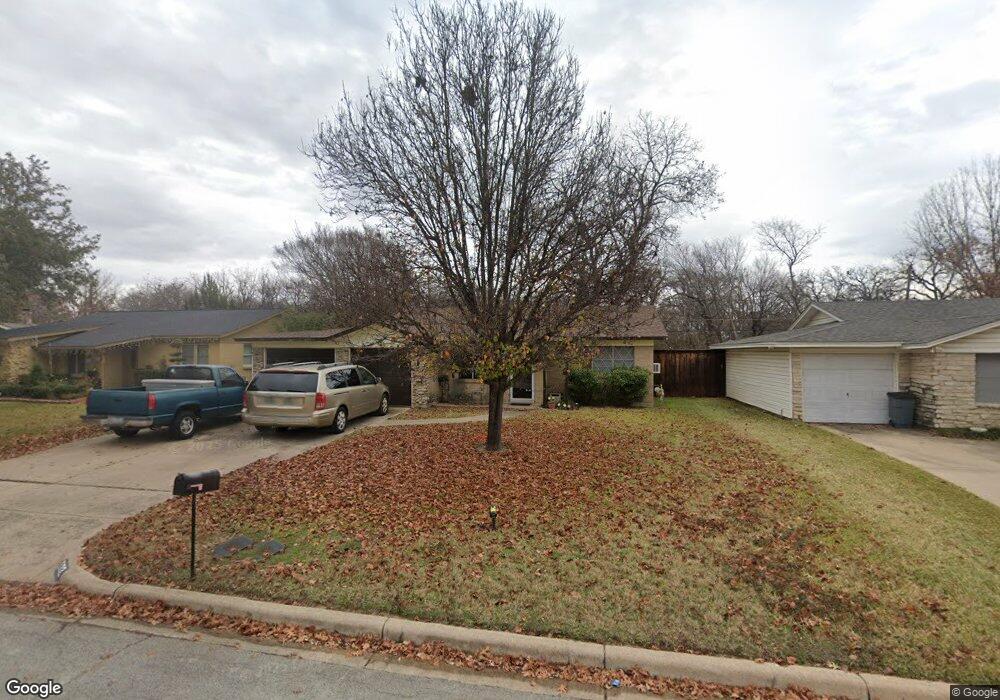
This home is located at 532 Livingston Dr, Hurst, TX 76053 and is currently estimated at $261,205, approximately $229 per square foot. 532 Livingston Dr is a home located in Tarrant County with nearby schools including Hurst Hills Elementary School, Hurst J High School, and L.D. Bell High School.
Ownership History
Date
Name
Owned For
Owner Type
Purchase Details
Closed on
Feb 6, 1998
Sold by
Byrd John Eric and Dickerson Misty G
Bought by
Wayner Steve and Wayner Doris F
Current Estimated Value
Home Financials for this Owner
Home Financials are based on the most recent Mortgage that was taken out on this home.
Original Mortgage
$55,750
Outstanding Balance
$9,799
Interest Rate
6.92%
Estimated Equity
$251,406
Purchase Details
Closed on
May 16, 1996
Sold by
Mannon Jean Ann
Bought by
Byrd John Eric and Dickerson Misty G
Home Financials for this Owner
Home Financials are based on the most recent Mortgage that was taken out on this home.
Original Mortgage
$50,460
Interest Rate
8.06%
Mortgage Type
FHA
Purchase Details
Closed on
Mar 9, 1994
Sold by
Harris Dema L
Bought by
Mannon Jean Ann
Create a Home Valuation Report for This Property
The Home Valuation Report is an in-depth analysis detailing your home's value as well as a comparison with similar homes in the area
Home Values in the Area
Average Home Value in this Area
Purchase History
| Date | Buyer | Sale Price | Title Company |
|---|---|---|---|
| Wayner Steve | -- | American Title Company | |
| Byrd John Eric | -- | Safeco Land Title | |
| Mannon Jean Ann | -- | -- |
Source: Public Records
Mortgage History
| Date | Status | Borrower | Loan Amount |
|---|---|---|---|
| Open | Wayner Steve | $55,750 | |
| Previous Owner | Byrd John Eric | $50,460 |
Source: Public Records
Tax History Compared to Growth
Tax History
| Year | Tax Paid | Tax Assessment Tax Assessment Total Assessment is a certain percentage of the fair market value that is determined by local assessors to be the total taxable value of land and additions on the property. | Land | Improvement |
|---|---|---|---|---|
| 2025 | $394 | $249,786 | $41,760 | $208,026 |
| 2024 | $394 | $249,786 | $41,760 | $208,026 |
| 2023 | $3,118 | $244,683 | $34,800 | $209,883 |
| 2022 | $3,257 | $192,633 | $34,800 | $157,833 |
| 2021 | $3,102 | $138,956 | $20,000 | $118,956 |
| 2020 | $2,813 | $129,646 | $20,000 | $109,646 |
| 2019 | $2,602 | $129,646 | $20,000 | $109,646 |
| 2018 | $737 | $96,631 | $20,000 | $76,631 |
| 2017 | $2,223 | $104,498 | $20,000 | $84,498 |
| 2016 | $2,021 | $85,171 | $20,000 | $65,171 |
| 2015 | $802 | $72,600 | $15,000 | $57,600 |
| 2014 | $802 | $72,600 | $15,000 | $57,600 |
Source: Public Records
Map
Nearby Homes
- 512 Billie Ruth Ln
- 649 Timberline Dr
- 425 Moore Creek Rd
- 405 Billy Creek Cir
- 632 Melbourne Ct
- 741 Ponderosa Dr
- 913 Zelda Dr
- 916 Zelda Dr
- 758 Briarwood Ln
- 756 Briarwood Ln
- 829 Joanna Dr
- 1001 Livingston Dr
- 833 W Cheryl Ave
- 808 Betty Ct
- 1000 Madrid St
- 744 Briarwood Ln
- 1016 Billie Ruth Ln
- 1200 Walker Dr
- 1304 W Redbud Dr
- 425 Ridgecrest Dr
- 528 Livingston Dr
- 536 Livingston Dr
- 540 Livingston Dr
- 524 Livingston Dr
- 533 Livingston Dr
- 537 Livingston Dr
- 544 Livingston Dr
- 520 Livingston Dr
- 525 Livingston Dr
- 541 Livingston Dr
- 548 Livingston Dr
- 516 Livingston Dr
- 545 Livingston Dr
- 522 Billie Ruth Ln
- 524 Billie Ruth Ln
- 517 Livingston Dr
- 549 Livingston Dr
- 518 Billie Ruth Ln
- 520 Billie Ruth Ln
- 528 Billie Ruth Ln