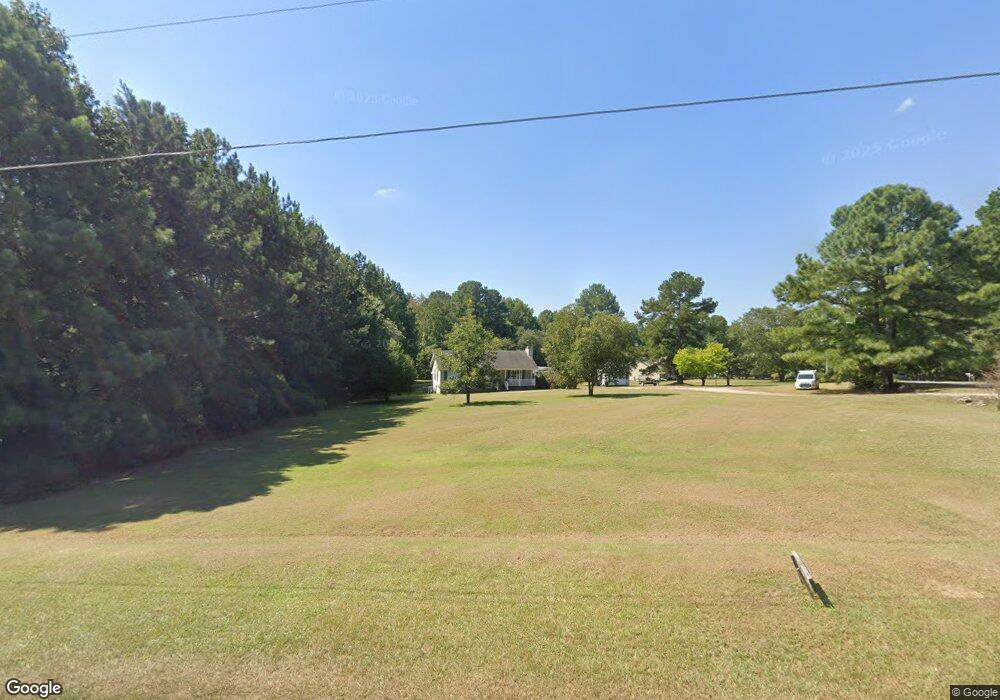
5321 New Dixie Ct Youngsville, NC 27596
Estimated Value: $273,000 - $331,659
3
Beds
2
Baths
1,168
Sq Ft
$256/Sq Ft
Est. Value
About This Home
This home is located at 5321 New Dixie Ct, Youngsville, NC 27596 and is currently estimated at $299,165, approximately $256 per square foot. 5321 New Dixie Ct is a home located in Wake County with nearby schools including Zebulon Elementary School, Zebulon Magnet Middle School, and Rolesville High School.
Ownership History
Date
Name
Owned For
Owner Type
Purchase Details
Closed on
Sep 25, 2014
Sold by
Rankin Bruce A and Rankin Shelley B
Bought by
Bailey Billy Joe
Current Estimated Value
Home Financials for this Owner
Home Financials are based on the most recent Mortgage that was taken out on this home.
Original Mortgage
$137,755
Outstanding Balance
$105,881
Interest Rate
4.17%
Mortgage Type
New Conventional
Estimated Equity
$193,284
Purchase Details
Closed on
Feb 2, 2012
Sold by
Fannie Mae
Bought by
Rankin Bruce A
Purchase Details
Closed on
Sep 13, 2011
Sold by
Mejia Carlos
Bought by
Fannie Mae
Purchase Details
Closed on
Jun 29, 2006
Sold by
Winstead Rebecca A and Winstead Bunton
Bought by
Mejia Carlos
Home Financials for this Owner
Home Financials are based on the most recent Mortgage that was taken out on this home.
Original Mortgage
$123,500
Interest Rate
6.57%
Mortgage Type
Purchase Money Mortgage
Create a Home Valuation Report for This Property
The Home Valuation Report is an in-depth analysis detailing your home's value as well as a comparison with similar homes in the area
Home Values in the Area
Average Home Value in this Area
Purchase History
| Date | Buyer | Sale Price | Title Company |
|---|---|---|---|
| Bailey Billy Joe | $135,000 | Investors Title Insurance Co | |
| Rankin Bruce A | -- | None Available | |
| Fannie Mae | $137,229 | None Available | |
| Mejia Carlos | $123,500 | None Available |
Source: Public Records
Mortgage History
| Date | Status | Borrower | Loan Amount |
|---|---|---|---|
| Open | Bailey Billy Joe | $137,755 | |
| Previous Owner | Mejia Carlos | $123,500 |
Source: Public Records
Tax History Compared to Growth
Tax History
| Year | Tax Paid | Tax Assessment Tax Assessment Total Assessment is a certain percentage of the fair market value that is determined by local assessors to be the total taxable value of land and additions on the property. | Land | Improvement |
|---|---|---|---|---|
| 2025 | $1,760 | $271,994 | $97,750 | $174,244 |
| 2024 | $1,709 | $271,994 | $97,750 | $174,244 |
| 2023 | $1,320 | $166,726 | $34,500 | $132,226 |
| 2022 | $1,224 | $166,726 | $34,500 | $132,226 |
| 2021 | $1,192 | $166,726 | $34,500 | $132,226 |
| 2020 | $1,172 | $166,726 | $34,500 | $132,226 |
| 2019 | $1,154 | $138,868 | $37,950 | $100,918 |
| 2018 | $1,062 | $138,868 | $37,950 | $100,918 |
| 2017 | $1,007 | $138,868 | $37,950 | $100,918 |
| 2016 | $987 | $138,868 | $37,950 | $100,918 |
| 2015 | $926 | $130,504 | $34,000 | $96,504 |
| 2014 | $879 | $130,504 | $34,000 | $96,504 |
Source: Public Records
Map
Nearby Homes
- 5021 Mitchell Town Rd
- 7404 Halifax Rd
- 5124 Grist Stone Way
- 5100 Grist Stone Way
- 4948 Zebulon Rd
- 4944 Zebulon Rd
- 8401 Mitchell Mill Rd
- 105 Perry Ln
- 5008 Hopkins Chapel Rd
- 5009 Hopkins Chapel Rd
- Lot 5 Triskel
- Lot 6 Triskel Ln
- 155 Diamond Creek Dr
- 205 Diamond Creek Dr
- 8524 Pascolo Way
- 25 Diamond Creek Dr
- 15 Diamond Creek Dr
- 20 Diamond Creek Dr
- 8420 Hopkins Glen Way
- Dunlin Plan at Kettle Creek
- 7808 New Ridge St
- 5309 New Dixie Ct
- 7804 New Ridge St
- 5301 New Dixie Ct
- 7817 New Ridge St
- 5316 New Dixie Ct
- 7801 Halifax Rd
- 5409 New Rebel Ct
- 5400 New Rebel Ct
- 7809 New Ridge St
- 5300 New Dixie Ct
- 7832 New Ridge St
- 5408 New Rebel Ct
- 7837 New Ridge St
- 5229 New Oak St
- 7817 New Rebel Ct
- 5233 New Oak St
- 7811 Halifax Rd
- 5412 New Rebel Ct
- 5225 New Oak St