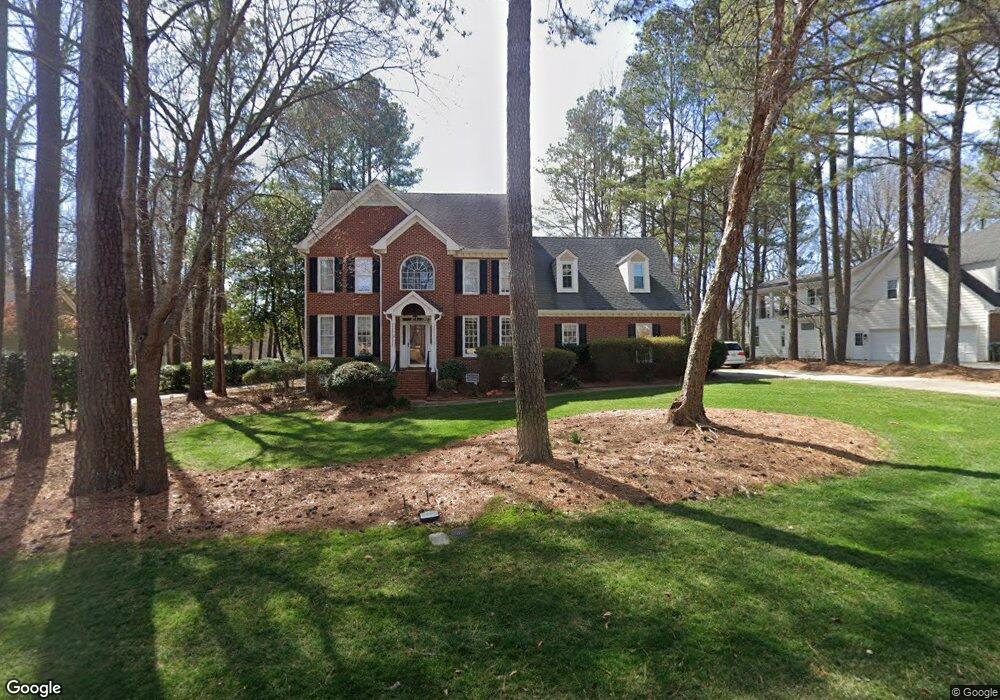
5324 Shoreline Ct Holly Springs, NC 27540
Estimated Value: $791,400 - $828,000
4
Beds
3
Baths
3,050
Sq Ft
$267/Sq Ft
Est. Value
About This Home
This home is located at 5324 Shoreline Ct, Holly Springs, NC 27540 and is currently estimated at $812,850, approximately $266 per square foot. 5324 Shoreline Ct is a home located in Wake County with nearby schools including Holly Ridge Elementary School, Holly Ridge Middle School, and Holly Springs High School.
Ownership History
Date
Name
Owned For
Owner Type
Purchase Details
Closed on
Feb 12, 2021
Sold by
Blanton George Andrew and Blanton Denise Ann
Bought by
Blanton Revocable Trust and Blanton
Current Estimated Value
Purchase Details
Closed on
Jan 29, 2018
Sold by
Tully Christopher M and Tully Margaret A
Bought by
Blanton George and Blanton Denise
Purchase Details
Closed on
Apr 17, 2001
Sold by
Harris Duane C
Bought by
Tully Christopher M and Tully Margaret A
Home Financials for this Owner
Home Financials are based on the most recent Mortgage that was taken out on this home.
Original Mortgage
$268,000
Interest Rate
6.98%
Purchase Details
Closed on
Jul 31, 1998
Sold by
Quinn Richard L and Quinn Faye R
Bought by
Harris Duane C
Home Financials for this Owner
Home Financials are based on the most recent Mortgage that was taken out on this home.
Original Mortgage
$306,500
Interest Rate
6.75%
Create a Home Valuation Report for This Property
The Home Valuation Report is an in-depth analysis detailing your home's value as well as a comparison with similar homes in the area
Home Values in the Area
Average Home Value in this Area
Purchase History
| Date | Buyer | Sale Price | Title Company |
|---|---|---|---|
| Blanton Revocable Trust | -- | None Listed On Document | |
| Blanton George | $445,000 | None Available | |
| Tully Christopher M | $330,000 | -- | |
| Harris Duane C | $306,500 | -- |
Source: Public Records
Mortgage History
| Date | Status | Borrower | Loan Amount |
|---|---|---|---|
| Previous Owner | Tully Christopher M | $268,000 | |
| Previous Owner | Harris Duane C | $306,500 |
Source: Public Records
Tax History Compared to Growth
Tax History
| Year | Tax Paid | Tax Assessment Tax Assessment Total Assessment is a certain percentage of the fair market value that is determined by local assessors to be the total taxable value of land and additions on the property. | Land | Improvement |
|---|---|---|---|---|
| 2025 | $6,331 | $733,342 | $232,500 | $500,842 |
| 2024 | $6,305 | $733,342 | $232,500 | $500,842 |
| 2023 | $5,219 | $482,032 | $108,000 | $374,032 |
| 2022 | $5,038 | $482,032 | $108,000 | $374,032 |
| 2021 | $4,944 | $482,032 | $108,000 | $374,032 |
| 2020 | $4,944 | $482,032 | $108,000 | $374,032 |
| 2019 | $4,700 | $388,981 | $120,000 | $268,981 |
| 2018 | $4,248 | $388,981 | $120,000 | $268,981 |
| 2017 | $695 | $388,981 | $120,000 | $268,981 |
| 2016 | $4,038 | $388,981 | $120,000 | $268,981 |
| 2015 | $2,746 | $412,225 | $143,000 | $269,225 |
| 2014 | $2,196 | $412,225 | $143,000 | $269,225 |
Source: Public Records
Map
Nearby Homes
- 5309 Shoreline Ct
- 5420 Lake Edge Dr
- 717 Bass Lake Rd
- 5200 Gable Ridge Ln
- 5317 Moonflower Ct
- 1108 Braswell Creek Point
- 4809 Greenpoint Ln
- 404 Prince Dr
- 204 Horncliffe Way
- 504 Prince Dr
- 305 Savannah Ridge Rd
- 215 Savannah Ridge Rd Unit 215
- 0/416 Holly Springs Rd
- 212 Chieftain Dr
- 500 Eno Dr
- 109 Lacombe Ct
- 137 Lacombe Ct
- 705 Morton Farm Rd
- 108 Eden Glen Dr
- 204 Crossway Ln
- 5316 Shoreline Ct
- 5328 Shoreline Ct
- 5400 Shoreline Ct
- 5321 Shoreline Ct
- 5308 Shoreline Ct
- 5512 Lake Edge Dr
- 5317 Shoreline Ct
- 5408 Shoreline Ct
- 5300 Shoreline Ct
- 4924 Sun Lake Ct Unit 415
- 4924 Sun Lake Ct
- 5105 Salem Ridge Rd
- 5412 Shoreline Ct
- 5401 Shoreline Ct
- 4920 Sun Lake Ct
- 4916 Sun Lake Ct
- 5301 Shoreline Ct
- 5109 Salem Ridge Rd
- 4928 Sun Lake Ct
- 5416 Shoreline Ct