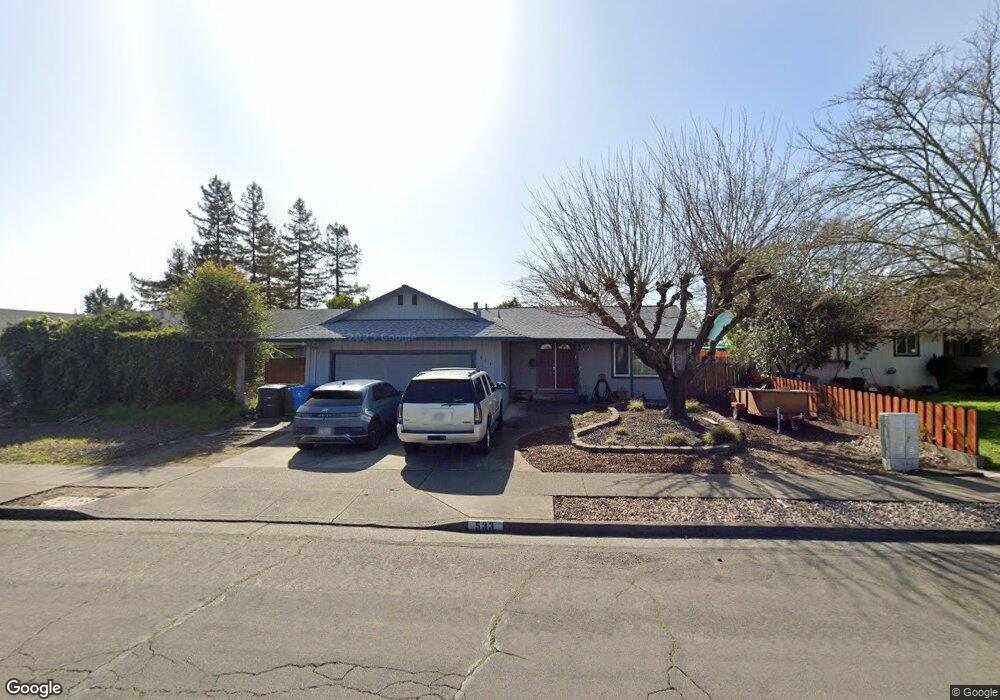
533 Saint Mary Dr Santa Rosa, CA 95409
Estimated Value: $632,000 - $658,989
3
Beds
2
Baths
1,240
Sq Ft
$518/Sq Ft
Est. Value
About This Home
This home is located at 533 Saint Mary Dr, Santa Rosa, CA 95409 and is currently estimated at $642,747, approximately $518 per square foot. 533 Saint Mary Dr is a home located in Sonoma County with nearby schools including Rincon Valley Middle School, Maria Carrillo High School, and Binkley Elementary Charter School.
Ownership History
Date
Name
Owned For
Owner Type
Purchase Details
Closed on
Jul 28, 2003
Sold by
Shaw Mindy and Mindy A Shaw 2001 Trust
Bought by
Murillo Mario and Murillo Concepcion R
Current Estimated Value
Home Financials for this Owner
Home Financials are based on the most recent Mortgage that was taken out on this home.
Original Mortgage
$300,000
Outstanding Balance
$127,385
Interest Rate
5.13%
Mortgage Type
Purchase Money Mortgage
Estimated Equity
$515,362
Purchase Details
Closed on
Mar 21, 2002
Sold by
Shaw Mindy
Bought by
Shaw Mindy and Mindy A Shaw 2001 Trust
Home Financials for this Owner
Home Financials are based on the most recent Mortgage that was taken out on this home.
Original Mortgage
$222,400
Interest Rate
6.84%
Purchase Details
Closed on
Jan 14, 1998
Sold by
Adamick Chester J
Bought by
Rafferty Lin L
Home Financials for this Owner
Home Financials are based on the most recent Mortgage that was taken out on this home.
Original Mortgage
$91,000
Interest Rate
7.05%
Create a Home Valuation Report for This Property
The Home Valuation Report is an in-depth analysis detailing your home's value as well as a comparison with similar homes in the area
Home Values in the Area
Average Home Value in this Area
Purchase History
| Date | Buyer | Sale Price | Title Company |
|---|---|---|---|
| Murillo Mario | $380,000 | Fidelity Natl Title Co | |
| Shaw Mindy | -- | Fidelity National Title Co | |
| Shaw Mindy | $278,000 | Fidelity National Title Co | |
| Rafferty Lin L | $84,509 | North American Title Co |
Source: Public Records
Mortgage History
| Date | Status | Borrower | Loan Amount |
|---|---|---|---|
| Open | Murillo Mario | $300,000 | |
| Previous Owner | Shaw Mindy | $222,400 | |
| Previous Owner | Rafferty Lin L | $91,000 |
Source: Public Records
Tax History Compared to Growth
Tax History
| Year | Tax Paid | Tax Assessment Tax Assessment Total Assessment is a certain percentage of the fair market value that is determined by local assessors to be the total taxable value of land and additions on the property. | Land | Improvement |
|---|---|---|---|---|
| 2025 | $6,222 | $540,262 | $213,261 | $327,001 |
| 2024 | $6,222 | $529,670 | $209,080 | $320,590 |
| 2023 | $6,222 | $519,285 | $204,981 | $314,304 |
| 2022 | $5,744 | $509,104 | $200,962 | $308,142 |
| 2021 | $5,629 | $499,122 | $197,022 | $302,100 |
| 2020 | $5,608 | $494,005 | $195,002 | $299,003 |
| 2019 | $5,556 | $484,320 | $191,179 | $293,141 |
| 2018 | $5,521 | $474,825 | $187,431 | $287,394 |
| 2017 | $5,420 | $465,515 | $183,756 | $281,759 |
| 2016 | $5,362 | $456,388 | $180,153 | $276,235 |
| 2015 | $4,851 | $419,000 | $165,000 | $254,000 |
| 2014 | $4,270 | $375,000 | $148,000 | $227,000 |
Source: Public Records
Map
Nearby Homes
- 164 Brookview Ct
- 103 Glenoak Ct
- 61 Coronado Cir
- 66 Coronado Cir
- 537 Emerald Park Ct
- 71 Oakcreek Ct
- 52 Oakstone Ct Unit 52
- 311 Algiers Ct
- 48 Shadyleaf Ct
- 29 Coronado Cir
- 31 Springhill Ct
- 5015 Charmian Dr
- 28 Springhill Ct
- 305 Simone Place N
- 5209 San Luis Ave
- 16 Redwood Ct Unit 55
- 13 Redwood Ct
- 5020 Roma St
- 5086 Charmian Dr
- 5243 Beaumont Way
- 539 Saint Mary Dr
- 527 Saint Mary Dr
- 545 Saint Mary Dr
- 4975 Canyon Dr
- 532 Saint Mary Dr
- 538 Saint Mary Dr
- 526 Saint Mary Dr
- 551 Saint Mary Dr
- 544 Saint Mary Dr
- 4981 Canyon Dr
- 557 Saint Mary Dr
- 535 Blackstone Ct
- 4972 Underwood Dr
- 539 Blackstone Ct
- 497 Saint Mary Dr
- 4972 Canyon Dr
- 550 Saint Mary Dr
- 4968 Canyon Dr
- 531 Blackstone Ct
- 563 Saint Mary Dr