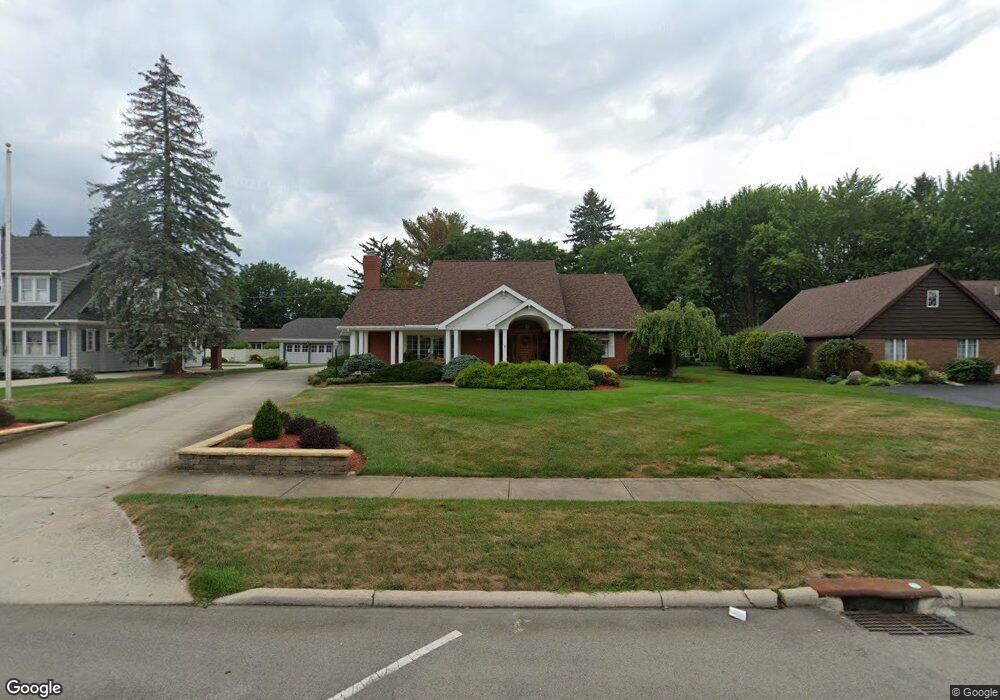
533 Vernon Heights Blvd Marion, OH 43302
Estimated Value: $381,000 - $490,000
4
Beds
4
Baths
3,121
Sq Ft
$138/Sq Ft
Est. Value
About This Home
This home is located at 533 Vernon Heights Blvd, Marion, OH 43302 and is currently estimated at $431,772, approximately $138 per square foot. 533 Vernon Heights Blvd is a home located in Marion County with nearby schools including Benjamin Harrison Elementary School, Ulysses S. Grant Middle School, and Harding High School.
Ownership History
Date
Name
Owned For
Owner Type
Purchase Details
Closed on
Oct 7, 2022
Sold by
Jeanette L Sens Trust
Bought by
Church Vernon and Church Mahealani
Current Estimated Value
Purchase Details
Closed on
Apr 23, 2022
Sold by
Thompson Charles A and Thompson Tyler L
Bought by
Starkey Steven Brent and Starkey Chloe Bronwyn
Purchase Details
Closed on
Feb 21, 2020
Bought by
Snes Jeanette L Trustee
Purchase Details
Closed on
May 5, 2016
Sold by
Synder Mary Joyce and Chamebrs Barbara
Bought by
533 Farm Holdigns Llc
Purchase Details
Closed on
Nov 7, 2012
Sold by
Pirik Christine M and Shrimplin Catherine S
Bought by
Sens Charles E and Sens Jeanette L
Purchase Details
Closed on
Jan 22, 2010
Sold by
Sens Jeanette L
Bought by
Sens Jeanette L and Sens Charles E
Purchase Details
Closed on
Sep 7, 2001
Bought by
Sens Jeanette L & Charles E Trustees
Purchase Details
Closed on
Jan 9, 2001
Bought by
Sens Jeanette L & Charles E Trustees
Create a Home Valuation Report for This Property
The Home Valuation Report is an in-depth analysis detailing your home's value as well as a comparison with similar homes in the area
Home Values in the Area
Average Home Value in this Area
Purchase History
| Date | Buyer | Sale Price | Title Company |
|---|---|---|---|
| Church Vernon | $330,000 | -- | |
| Starkey Steven Brent | $389,900 | None Listed On Document | |
| Snes Jeanette L Trustee | -- | -- | |
| 533 Farm Holdigns Llc | $375,000 | Chicago Title | |
| Sens Charles E | $820,000 | None Available | |
| Sens Jeanette L | -- | None Available | |
| Sens Jeanette L & Charles E Trustees | $250,000 | -- | |
| Sens Jeanette L & Charles E Trustees | -- | -- |
Source: Public Records
Tax History Compared to Growth
Tax History
| Year | Tax Paid | Tax Assessment Tax Assessment Total Assessment is a certain percentage of the fair market value that is determined by local assessors to be the total taxable value of land and additions on the property. | Land | Improvement |
|---|---|---|---|---|
| 2024 | $4,549 | $121,570 | $13,180 | $108,390 |
| 2023 | $4,549 | $121,570 | $13,180 | $108,390 |
| 2022 | $3,912 | $121,570 | $13,180 | $108,390 |
| 2021 | $3,316 | $94,840 | $11,460 | $83,380 |
| 2020 | $3,317 | $94,840 | $11,460 | $83,380 |
| 2019 | $3,315 | $94,840 | $11,460 | $83,380 |
| 2018 | $2,883 | $83,700 | $11,450 | $72,250 |
| 2017 | $2,921 | $83,700 | $11,450 | $72,250 |
| 2016 | $2,909 | $83,700 | $11,450 | $72,250 |
| 2015 | $2,931 | $82,620 | $10,900 | $71,720 |
| 2014 | $2,930 | $82,620 | $10,900 | $71,720 |
| 2012 | $3,010 | $84,010 | $12,540 | $71,470 |
Source: Public Records
Map
Nearby Homes
- 514 King Ave
- 556 Hane Ave
- 667 King Ave
- 482 King Ave
- 648 Fairhaven Ave
- 686 Mount Vernon Ave Unit AV
- 769 Summit St
- 488 Forest Lawn Blvd
- 701 Brightwood Dr
- 763 Leetonia Rd
- 400 Forest Lawn Blvd
- 858 Vernon Heights Cir
- 265 S Seffner Ave
- 249 S Grand Ave
- 840 Forest Lawn Dr
- 222 Uhler Ave
- 523 Normandy Dr
- 338 Powhattan St
- 587 Normandy Dr
- 556 S Vine St
- 545 Vernon Heights Blvd
- 511 Vernon Heights Blvd
- 553 Vernon Heights Blvd
- 528 King Ave
- 542 King Ave
- 561 Vernon Heights Blvd
- 538 Vernon Heights Blvd
- 514 Vernon Heights Blvd
- 509 King (P)
- 542 Vernon Heights Blvd
- 512 Vernon Heights Blvd
- 483 Vernon Heights Blvd
- 565 Vernon Heights Blvd
- 570 King Ave
- 523 King Ave
- 529 King Ave
- 560 Vernon Heights Blvd
- 506 Vernon Heights Blvd
- 535 King Ave
- 509 King Ave