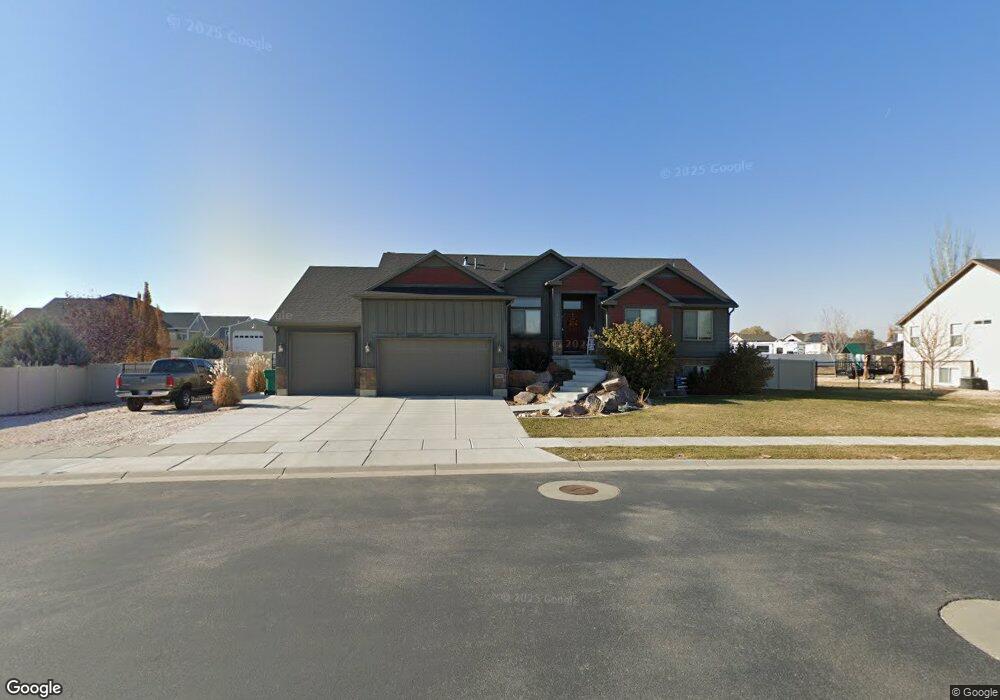
5331 S 6050 W Unit 78 Hooper, UT 84315
Estimated Value: $627,000 - $718,055
6
Beds
3
Baths
3,415
Sq Ft
$197/Sq Ft
Est. Value
About This Home
This home is located at 5331 S 6050 W Unit 78, Hooper, UT 84315 and is currently estimated at $673,264, approximately $197 per square foot. 5331 S 6050 W Unit 78 is a home located in Weber County with nearby schools including Hooper Elementary School, Rocky Mountain Junior High School, and Fremont High School.
Ownership History
Date
Name
Owned For
Owner Type
Purchase Details
Closed on
Aug 25, 2020
Sold by
Belt Cassie and Belt Cascy
Bought by
Belt Cassie and Belt Casey S
Current Estimated Value
Home Financials for this Owner
Home Financials are based on the most recent Mortgage that was taken out on this home.
Original Mortgage
$309,000
Outstanding Balance
$274,217
Interest Rate
2.9%
Mortgage Type
New Conventional
Estimated Equity
$399,047
Purchase Details
Closed on
Dec 11, 2014
Sold by
Nilson And Company Inc
Bought by
Belt Cassie and Belt Casey
Home Financials for this Owner
Home Financials are based on the most recent Mortgage that was taken out on this home.
Original Mortgage
$332,690
Interest Rate
3.95%
Mortgage Type
New Conventional
Purchase Details
Closed on
Jun 28, 2013
Sold by
Lakeview Farms I Llc
Bought by
Nilson And Company Inc and Nilson Homes
Create a Home Valuation Report for This Property
The Home Valuation Report is an in-depth analysis detailing your home's value as well as a comparison with similar homes in the area
Home Values in the Area
Average Home Value in this Area
Purchase History
| Date | Buyer | Sale Price | Title Company |
|---|---|---|---|
| Belt Cassie | -- | Backman Ntp | |
| Belt Cassie | -- | Bonneville Superior Title Co | |
| Nilson And Company Inc | -- | Mountain View Title Ogden |
Source: Public Records
Mortgage History
| Date | Status | Borrower | Loan Amount |
|---|---|---|---|
| Open | Belt Cassie | $309,000 | |
| Closed | Belt Cassie | $332,690 |
Source: Public Records
Tax History Compared to Growth
Tax History
| Year | Tax Paid | Tax Assessment Tax Assessment Total Assessment is a certain percentage of the fair market value that is determined by local assessors to be the total taxable value of land and additions on the property. | Land | Improvement |
|---|---|---|---|---|
| 2025 | $3,936 | $686,453 | $225,395 | $461,058 |
| 2024 | $3,790 | $370,149 | $123,954 | $246,195 |
| 2023 | $3,768 | $364,651 | $123,910 | $240,741 |
| 2022 | $3,444 | $341,000 | $99,109 | $241,891 |
| 2021 | $3,105 | $518,000 | $115,258 | $402,742 |
| 2020 | $2,905 | $444,000 | $100,260 | $343,740 |
| 2019 | $2,843 | $411,000 | $90,091 | $320,909 |
| 2018 | $2,836 | $392,000 | $80,054 | $311,946 |
| 2017 | $2,644 | $354,000 | $80,092 | $273,908 |
| 2016 | $2,517 | $181,894 | $38,174 | $143,720 |
| 2015 | $2,464 | $175,481 | $38,605 | $136,876 |
| 2014 | $1,013 | $70,190 | $70,190 | $0 |
Source: Public Records
Map
Nearby Homes
- 6014 W 5300 S
- 0 W 5500 S
- 6036 W 4700 S
- 5947 W 4600 S
- 3729 S 5600 W Unit 6
- 3720 S 5600 W Unit 2
- 3719 S 5600 W Unit 7
- 5335 W 5500 S
- 3632 S 5400 W
- 5752 W 2425 N
- 5319 S 7100 W
- 4146 S 5800 W Unit 5
- 4163 S 5800 W Unit 2
- 4879 S 5050 W
- 5801 S 7100 W
- 4909 W 5850 S
- 3191 S 5100 St W Unit 1
- 4111 S 5350 W
- 4700 W 5500 S
- 4931 S 4700 W
- 5331 S 6050 W
- 5321 S 6050 W Unit 77
- 6066 W 5350 S
- 5326 S 6100 W Unit 7
- 5326 S 6100 W
- 5338 S 6100 W
- 5322 S 6050 W
- 5334 S 6050 W Unit 90
- 6082 W 5350 S
- 5346 S 6050 W
- 5311 S 6050 W
- 5312 S 6050 W
- 5312 S 6050 W Unit 28
- 5318 S 6100 W Unit 8
- 5318 S 6100 W
- 6065 W 5350 S
- 6051 W 5350 S
- 6075 W 5300 S
- 6093 W 5300 S
- 6099 W 5300 S Unit 21