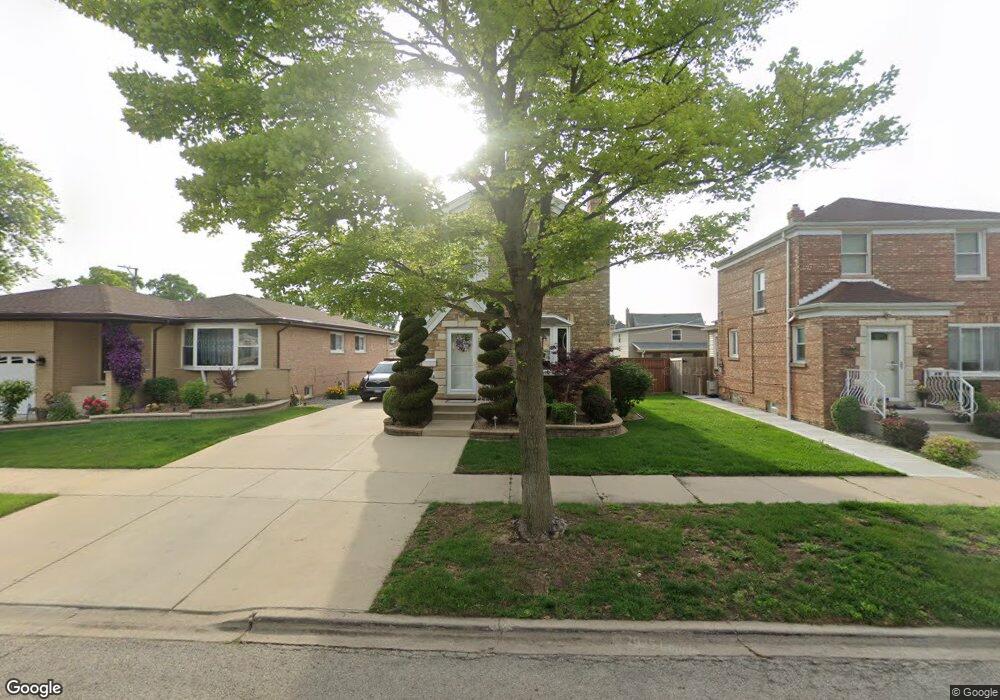
5337 S New England Ave Chicago, IL 60638
Garfield Ridge NeighborhoodEstimated Value: $337,000 - $363,938
3
Beds
1
Bath
1,240
Sq Ft
$283/Sq Ft
Est. Value
About This Home
This home is located at 5337 S New England Ave, Chicago, IL 60638 and is currently estimated at $350,485, approximately $282 per square foot. 5337 S New England Ave is a home located in Cook County with nearby schools including Byrne Elementary School, Kennedy High School, and St Daniel The Prophet School.
Ownership History
Date
Name
Owned For
Owner Type
Purchase Details
Closed on
Nov 29, 2001
Sold by
Mackevicius Natalia K
Bought by
Crouchelli Thomas
Current Estimated Value
Home Financials for this Owner
Home Financials are based on the most recent Mortgage that was taken out on this home.
Original Mortgage
$149,000
Outstanding Balance
$54,673
Interest Rate
5.75%
Estimated Equity
$295,812
Purchase Details
Closed on
Nov 30, 1998
Sold by
Petraitis Stanley B and Petraitis Karen A
Bought by
Mackevicius Natalia K
Home Financials for this Owner
Home Financials are based on the most recent Mortgage that was taken out on this home.
Original Mortgage
$123,920
Interest Rate
7.17%
Purchase Details
Closed on
Oct 4, 1993
Sold by
Hudon Francis J and Hudon Lynn A
Bought by
Petraitis Stanley B and Klima Karen A
Home Financials for this Owner
Home Financials are based on the most recent Mortgage that was taken out on this home.
Original Mortgage
$116,350
Interest Rate
7%
Create a Home Valuation Report for This Property
The Home Valuation Report is an in-depth analysis detailing your home's value as well as a comparison with similar homes in the area
Home Values in the Area
Average Home Value in this Area
Purchase History
| Date | Buyer | Sale Price | Title Company |
|---|---|---|---|
| Crouchelli Thomas | $191,000 | Stewart Title | |
| Mackevicius Natalia K | $155,000 | Professional National Title | |
| Petraitis Stanley B | $86,666 | -- |
Source: Public Records
Mortgage History
| Date | Status | Borrower | Loan Amount |
|---|---|---|---|
| Open | Crouchelli Thomas | $149,000 | |
| Previous Owner | Mackevicius Natalia K | $123,920 | |
| Previous Owner | Petraitis Stanley B | $116,350 |
Source: Public Records
Tax History Compared to Growth
Tax History
| Year | Tax Paid | Tax Assessment Tax Assessment Total Assessment is a certain percentage of the fair market value that is determined by local assessors to be the total taxable value of land and additions on the property. | Land | Improvement |
|---|---|---|---|---|
| 2024 | $4,812 | $30,000 | $9,310 | $20,690 |
| 2023 | $4,670 | $26,001 | $8,313 | $17,688 |
| 2022 | $4,670 | $26,001 | $8,313 | $17,688 |
| 2021 | $4,558 | $25,999 | $8,312 | $17,687 |
| 2020 | $3,934 | $20,648 | $6,650 | $13,998 |
| 2019 | $3,946 | $22,943 | $6,650 | $16,293 |
| 2018 | $4,096 | $24,037 | $6,650 | $17,387 |
| 2017 | $3,388 | $19,012 | $5,985 | $13,027 |
| 2016 | $3,476 | $19,737 | $5,985 | $13,752 |
| 2015 | $3,159 | $19,737 | $5,985 | $13,752 |
| 2014 | $3,145 | $19,390 | $5,652 | $13,738 |
| 2013 | $3,073 | $19,390 | $5,652 | $13,738 |
Source: Public Records
Map
Nearby Homes
- 5427 S Newcastle Ave
- 5415 S Oak Park Ave
- 5359 S Nordica Ave
- 5520 S New England Ave
- 5148 S Newland Ave
- 5532 S Oak Park Ave
- 5137 S Rutherford Ave
- 5536 S Normandy Ave
- 5622 S Oak Park Ave
- 5605 S Nordica Ave
- 5112 S Nashville Ave
- 5653 S Normandy Ave
- 5637 S Natoma Ave
- 5733 S New England Ave
- 7235 Park Ave
- 5326 S Nagle Ave
- 5745 S Sayre Ave
- 5250 S Nagle Ave
- 5402 S 73rd Ave
- 5248 S Narragansett Ave
- 5343 S New England Ave
- 5333 S New England Ave
- 5345 S New England Ave
- 5329 S New England Ave
- 5349 S New England Ave
- 5336 S Newcastle Ave
- 5340 S Newcastle Ave
- 5334 S Newcastle Ave
- 5353 S New England Ave
- 5344 S Newcastle Ave
- 5323 S New England Ave
- 5330 S Newcastle Ave
- 5350 S Newcastle Ave
- 5326 S Newcastle Ave
- 5357 S New England Ave
- 5338 S New England Ave
- 5340 S New England Ave
- 5334 S New England Ave
- 5317 S New England Ave
- 5352 S Newcastle Ave