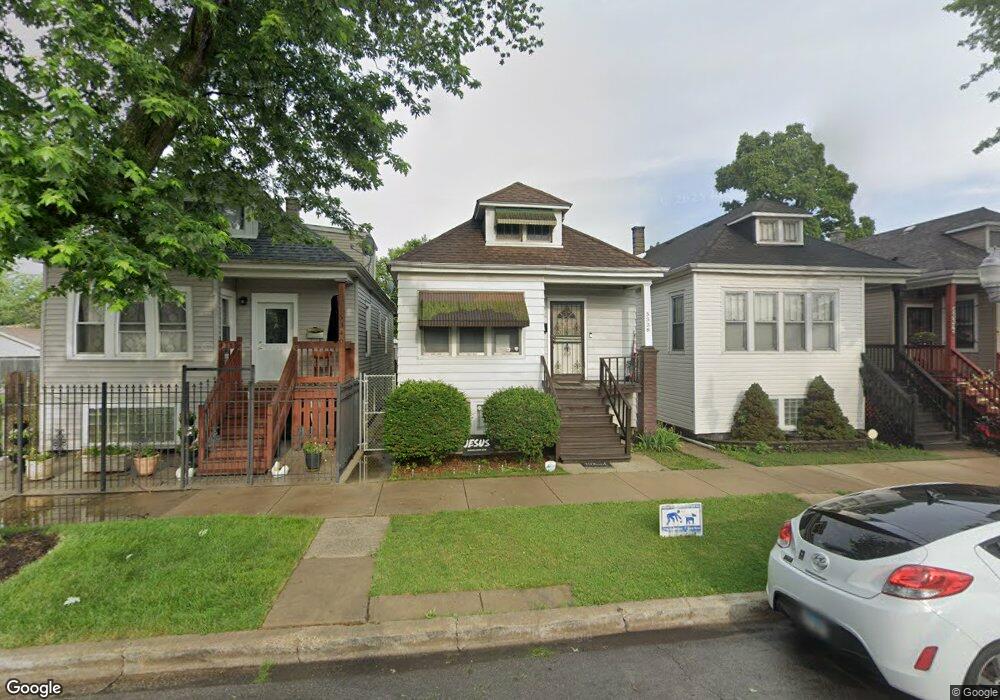
5338 S Seeley Ave Chicago, IL 60609
Back of the Yards NeighborhoodEstimated Value: $128,000 - $202,000
2
Beds
1
Bath
804
Sq Ft
$218/Sq Ft
Est. Value
About This Home
This home is located at 5338 S Seeley Ave, Chicago, IL 60609 and is currently estimated at $175,361, approximately $218 per square foot. 5338 S Seeley Ave is a home located in Cook County with nearby schools including Fulton Elementary School, CICS Basil, and Horizon Science Academy – Southwest Chicago.
Ownership History
Date
Name
Owned For
Owner Type
Purchase Details
Closed on
Mar 1, 2019
Sold by
Jones Ann
Bought by
Jones Ann and Bailey Nelson L
Current Estimated Value
Purchase Details
Closed on
Sep 9, 1994
Sold by
Dollars Express Inc
Bought by
Jackson Mattie B
Home Financials for this Owner
Home Financials are based on the most recent Mortgage that was taken out on this home.
Original Mortgage
$52,821
Interest Rate
8.44%
Purchase Details
Closed on
Feb 24, 1994
Sold by
Palos Bank & Trust Company
Bought by
Mccormick Wayne
Home Financials for this Owner
Home Financials are based on the most recent Mortgage that was taken out on this home.
Original Mortgage
$35,000
Interest Rate
7.1%
Purchase Details
Closed on
Jan 4, 1993
Sold by
Hewitt Margaret and Crawford Frances
Bought by
Palos Bank & Trust Company
Create a Home Valuation Report for This Property
The Home Valuation Report is an in-depth analysis detailing your home's value as well as a comparison with similar homes in the area
Home Values in the Area
Average Home Value in this Area
Purchase History
| Date | Buyer | Sale Price | Title Company |
|---|---|---|---|
| Jones Ann | -- | None Available | |
| Jackson Mattie B | $90,000 | First American Title | |
| Dollars Express Inc | -- | 1St American Title | |
| Mccormick Wayne | $11,000 | -- | |
| Palos Bank & Trust Company | $5,333 | -- |
Source: Public Records
Mortgage History
| Date | Status | Borrower | Loan Amount |
|---|---|---|---|
| Closed | Jackson Mattie B | $52,821 | |
| Previous Owner | Mccormick Wayne | $35,000 |
Source: Public Records
Tax History Compared to Growth
Tax History
| Year | Tax Paid | Tax Assessment Tax Assessment Total Assessment is a certain percentage of the fair market value that is determined by local assessors to be the total taxable value of land and additions on the property. | Land | Improvement |
|---|---|---|---|---|
| 2024 | $994 | $6,801 | $938 | $5,863 |
| 2023 | $947 | $8,000 | $2,031 | $5,969 |
| 2022 | $947 | $8,000 | $2,031 | $5,969 |
| 2021 | $939 | $7,999 | $2,031 | $5,968 |
| 2020 | $832 | $6,813 | $2,031 | $4,782 |
| 2019 | $854 | $7,655 | $2,031 | $5,624 |
| 2018 | $839 | $7,655 | $2,031 | $5,624 |
| 2017 | $947 | $7,747 | $1,875 | $5,872 |
| 2016 | $1,058 | $7,747 | $1,875 | $5,872 |
| 2015 | $946 | $7,747 | $1,875 | $5,872 |
| 2014 | $811 | $6,905 | $1,718 | $5,187 |
| 2013 | $784 | $6,905 | $1,718 | $5,187 |
Source: Public Records
Map
Nearby Homes
- 5350 S Winchester Ave
- 2103 W 52nd St
- 5310 S Wolcott Ave
- 2050 W 52nd St
- 2208 W 54th Place
- 5427 S Wolcott Ave
- 5514 S Winchester Ave
- 5336 S Honore St
- 5244 S Honore St
- 5357 S Honore St
- 1837 W Garfield Blvd
- 5338 S Wood St
- 5225 S Wood St
- 5217 S Wood St
- 5731 S Hoyne Ave
- 5712 S Wolcott Ave
- 5157 S Hermitage Ave
- 5723 S Wolcott Ave
- 5207 S Artesian Ave
- 2309 W 50th Place
- 5340 S Seeley Ave
- 5336 S Seeley Ave
- 5334 S Seeley Ave
- 5350 S Seeley Ave
- 5352 S Seeley Ave
- 5341 S Hoyne Ave
- 5335 S Hoyne Ave
- 5354 S Seeley Ave
- 5337 S Seeley Ave
- 5347 S Hoyne Ave
- 5343 S Hoyne Ave
- 5343 S Hoyne Ave
- 5335 S Seeley Ave
- 5345 S Hoyne Ave
- 5345 S Hoyne Ave
- 5349 S Hoyne Ave
- 5349 S Seeley Ave
- 5341 S Seeley Ave
- 5343 S Seeley Ave
- 5358 S Seeley Ave