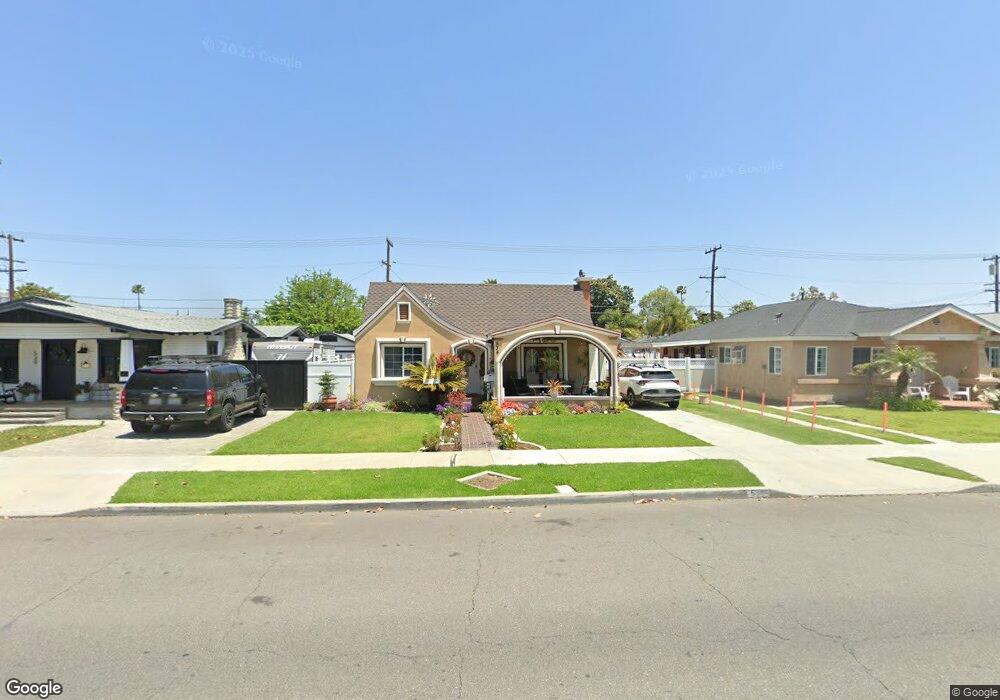
534 S Citron St Anaheim, CA 92805
The Colony NeighborhoodEstimated Value: $819,000 - $942,000
3
Beds
2
Baths
1,336
Sq Ft
$645/Sq Ft
Est. Value
About This Home
This home is located at 534 S Citron St, Anaheim, CA 92805 and is currently estimated at $861,941, approximately $645 per square foot. 534 S Citron St is a home located in Orange County with nearby schools including Benjamin Franklin Elementary School, Sycamore Junior High School, and Anaheim High School.
Ownership History
Date
Name
Owned For
Owner Type
Purchase Details
Closed on
Sep 12, 2018
Sold by
Tejeda Alexandra and Tejada Alexandra
Bought by
Tejeda Alexandra
Current Estimated Value
Home Financials for this Owner
Home Financials are based on the most recent Mortgage that was taken out on this home.
Original Mortgage
$103,000
Interest Rate
4.6%
Mortgage Type
New Conventional
Purchase Details
Closed on
Aug 22, 2006
Sold by
Tejada Alexandra and Tejada Alexandra Liccete
Bought by
Tejada Alexandra
Home Financials for this Owner
Home Financials are based on the most recent Mortgage that was taken out on this home.
Original Mortgage
$375,000
Interest Rate
6.76%
Mortgage Type
New Conventional
Purchase Details
Closed on
Dec 9, 2004
Sold by
Tejeda Alexandra Liccete
Bought by
Tejeda Alexandra Liccete
Home Financials for this Owner
Home Financials are based on the most recent Mortgage that was taken out on this home.
Original Mortgage
$150,000
Interest Rate
6.99%
Mortgage Type
New Conventional
Create a Home Valuation Report for This Property
The Home Valuation Report is an in-depth analysis detailing your home's value as well as a comparison with similar homes in the area
Home Values in the Area
Average Home Value in this Area
Purchase History
| Date | Buyer | Sale Price | Title Company |
|---|---|---|---|
| Tejeda Alexandra | -- | First American Title Co | |
| Tejada Alexandra | -- | Investors Title Company | |
| Tejeda Alexandra Liccete | -- | Southland Title |
Source: Public Records
Mortgage History
| Date | Status | Borrower | Loan Amount |
|---|---|---|---|
| Closed | Tejeda Alexandra | $103,000 | |
| Closed | Tejada Alexandra | $375,000 | |
| Closed | Tejeda Alexandra Liccete | $150,000 |
Source: Public Records
Tax History Compared to Growth
Tax History
| Year | Tax Paid | Tax Assessment Tax Assessment Total Assessment is a certain percentage of the fair market value that is determined by local assessors to be the total taxable value of land and additions on the property. | Land | Improvement |
|---|---|---|---|---|
| 2025 | $903 | $54,731 | $27,179 | $27,552 |
| 2024 | $903 | $53,658 | $26,646 | $27,012 |
| 2023 | $878 | $52,606 | $26,123 | $26,483 |
| 2022 | $860 | $51,575 | $25,611 | $25,964 |
| 2021 | $855 | $50,564 | $25,109 | $25,455 |
| 2020 | $848 | $50,046 | $24,852 | $25,194 |
| 2019 | $831 | $49,065 | $24,365 | $24,700 |
| 2018 | $815 | $48,103 | $23,887 | $24,216 |
| 2017 | $790 | $47,160 | $23,418 | $23,742 |
| 2016 | $783 | $46,236 | $22,959 | $23,277 |
| 2015 | $773 | $45,542 | $22,614 | $22,928 |
| 2014 | $736 | $44,650 | $22,171 | $22,479 |
Source: Public Records
Map
Nearby Homes
- 523 S Citron St
- 526 W Water St
- 719 S Pine St
- 609 S Helena St
- 701 W Provential Dr
- 208 S Illinois St
- 615 S Hazelwood St
- 628 S Clementine St
- 435 W Center Street Promenade Unit 331
- 435 W Center Street Promenade Unit 401
- 435 W Center Street Promenade Unit 400
- 1136 W Broadway
- 616 S Boxwood St
- 833 S Lemon St
- 1131 W Beacon Ave
- 425 S Anaheim Blvd Unit 3
- 401 S Anaheim Blvd Unit 7
- 713 S Anaheim Blvd
- 510 S Anaheim Blvd Unit 7
- 967 S Citron St Unit 3
- 538 S Citron St
- 530 S Citron St
- 542 S Citron St
- 526 S Citron St
- 535 S Resh St
- 539 S Resh St
- 531 S Resh St
- 546 S Citron St
- 522 S Citron St
- 527 S Resh St
- 543 S Resh St
- 535 S Citron St
- 539 S Citron St
- 531 S Citron St
- 549 S Resh St
- 523 S Resh St
- 541 S Citron St
- 550 S Citron St
- 518 S Citron St
- 527 S Citron St