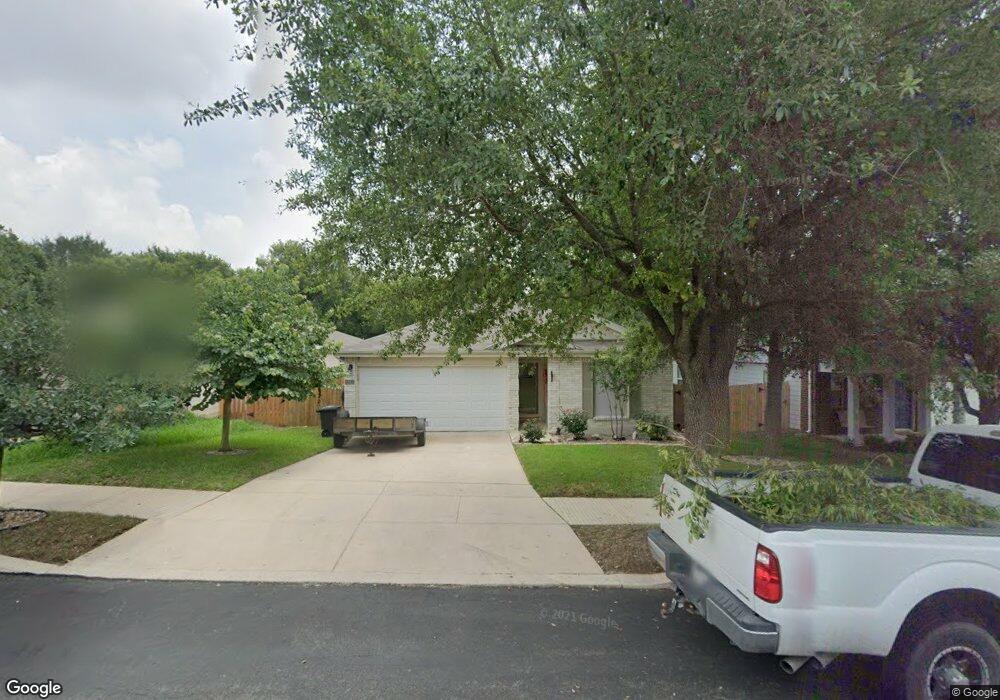
5342 Missouri Bend San Antonio, TX 78247
Thousand Oaks NeighborhoodEstimated Value: $272,906 - $285,000
3
Beds
2
Baths
1,439
Sq Ft
$194/Sq Ft
Est. Value
About This Home
This home is located at 5342 Missouri Bend, San Antonio, TX 78247 and is currently estimated at $278,977, approximately $193 per square foot. 5342 Missouri Bend is a home located in Bexar County with nearby schools including Steubing Ranch Elementary School, Harris Middle School, and Madison High School.
Ownership History
Date
Name
Owned For
Owner Type
Purchase Details
Closed on
Oct 19, 2011
Sold by
Mccaskill Mary A
Bought by
Wiley Deborah A
Current Estimated Value
Home Financials for this Owner
Home Financials are based on the most recent Mortgage that was taken out on this home.
Original Mortgage
$141,324
Outstanding Balance
$97,772
Interest Rate
4.4%
Mortgage Type
FHA
Estimated Equity
$181,205
Purchase Details
Closed on
Jun 29, 2009
Sold by
Feuerbacher Joyce Ann and Altgelt Hunter Searing
Bought by
Mccaskill Mary A
Home Financials for this Owner
Home Financials are based on the most recent Mortgage that was taken out on this home.
Original Mortgage
$109,600
Interest Rate
4.84%
Mortgage Type
Purchase Money Mortgage
Purchase Details
Closed on
Oct 6, 2003
Sold by
Continental Homes Of Texas Lp
Bought by
Feuerbacher Joyce Ann
Home Financials for this Owner
Home Financials are based on the most recent Mortgage that was taken out on this home.
Original Mortgage
$91,500
Interest Rate
6.25%
Mortgage Type
Purchase Money Mortgage
Create a Home Valuation Report for This Property
The Home Valuation Report is an in-depth analysis detailing your home's value as well as a comparison with similar homes in the area
Home Values in the Area
Average Home Value in this Area
Purchase History
| Date | Buyer | Sale Price | Title Company |
|---|---|---|---|
| Wiley Deborah A | -- | Ttt | |
| Mccaskill Mary A | -- | Stc | |
| Feuerbacher Joyce Ann | -- | -- |
Source: Public Records
Mortgage History
| Date | Status | Borrower | Loan Amount |
|---|---|---|---|
| Open | Wiley Deborah A | $141,324 | |
| Previous Owner | Mccaskill Mary A | $109,600 | |
| Previous Owner | Feuerbacher Joyce Ann | $91,500 |
Source: Public Records
Tax History Compared to Growth
Tax History
| Year | Tax Paid | Tax Assessment Tax Assessment Total Assessment is a certain percentage of the fair market value that is determined by local assessors to be the total taxable value of land and additions on the property. | Land | Improvement |
|---|---|---|---|---|
| 2025 | $2,318 | $264,300 | $59,560 | $204,740 |
| 2024 | $2,318 | $258,400 | $59,560 | $230,190 |
| 2023 | $2,318 | $234,909 | $59,560 | $226,960 |
| 2022 | $5,270 | $213,554 | $46,450 | $189,960 |
| 2021 | $4,960 | $194,140 | $36,390 | $157,750 |
| 2020 | $4,746 | $183,000 | $35,670 | $147,330 |
| 2019 | $4,847 | $182,000 | $32,240 | $149,760 |
| 2018 | $4,539 | $170,000 | $32,240 | $137,760 |
| 2017 | $4,417 | $163,900 | $32,240 | $131,730 |
| 2016 | $4,050 | $150,280 | $32,240 | $118,040 |
| 2015 | $3,596 | $144,330 | $23,930 | $120,400 |
| 2014 | $3,596 | $139,480 | $0 | $0 |
Source: Public Records
Map
Nearby Homes
- 5146 Erickson Bluff
- 5211 Stormy Autumn
- 5403 Stormy Autumn
- 15931 Darlington Gap
- 5330 Argyle Way
- 17023 Ashbury Lodge
- 5638 Arcadia Park
- 5315 Argyle Way
- 5106 Stormy Autumn
- 15810 Marisa Place
- 17203 Ashbury Lodge
- 16619 Wolf Ridge St
- 17211 Eldon Rock
- 5530 Rangeland St
- 5419 Stormy Dawn
- 5210 Stormy Dawn
- 5122 Stormy Dawn
- 4631 Eldon Run
- 17006 Darlington Run
- 17227 Tarkio Way
- 5402 Missouri Bend
- 5338 Missouri Bend
- 5406 Missouri Bend
- 5334 Missouri Bend
- 15703 Spruce Stream
- 5410 Missouri Bend
- 5330 Missouri Bend
- 15702 Spruce Stream
- 5414 Missouri Bend
- 5326 Missouri Bend
- 5335 Missouri Bend
- 15707 Spruce Stream
- 15706 Spruce Stream
- 5331 Missouri Bend
- 5418 Missouri Bend
- 5322 Missouri Bend
- 15711 Spruce Stream
- 5327 Missouri Bend
- 5422 Missouri Bend
- 15711 Ashley Manor