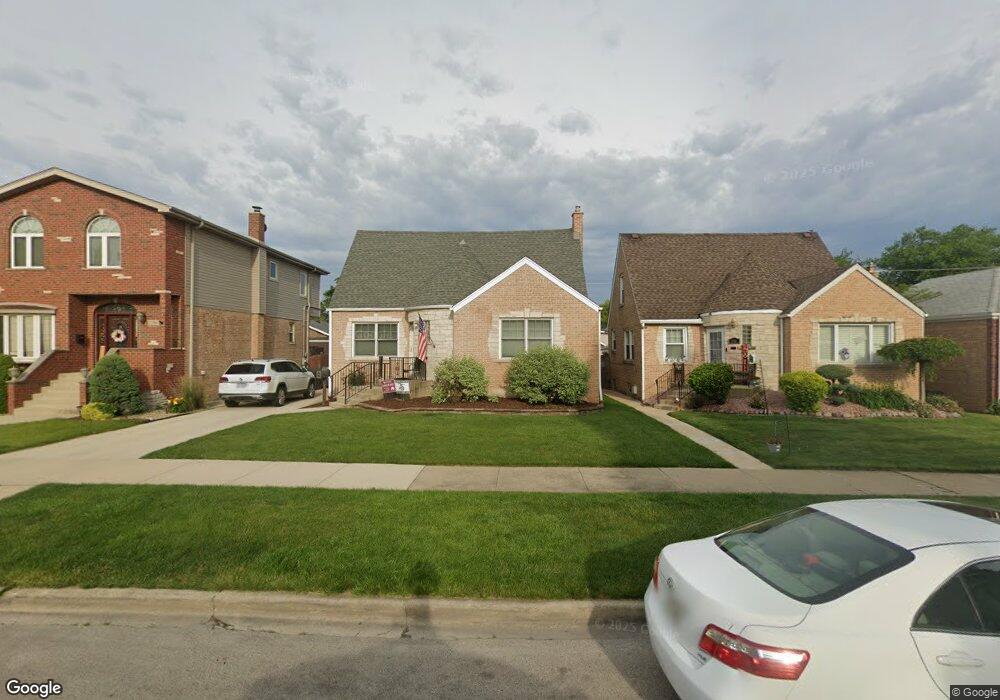
5344 S Newcastle Ave Chicago, IL 60638
Garfield Ridge NeighborhoodEstimated Value: $329,000 - $455,000
3
Beds
2
Baths
1,249
Sq Ft
$309/Sq Ft
Est. Value
About This Home
This home is located at 5344 S Newcastle Ave, Chicago, IL 60638 and is currently estimated at $386,035, approximately $309 per square foot. 5344 S Newcastle Ave is a home located in Cook County with nearby schools including Byrne Elementary School, Kennedy High School, and St Daniel The Prophet School.
Ownership History
Date
Name
Owned For
Owner Type
Purchase Details
Closed on
Dec 14, 2012
Sold by
Plewa Marian and Plewa Maria
Bought by
Lynch Ryan P and Marinelarena Liza
Current Estimated Value
Home Financials for this Owner
Home Financials are based on the most recent Mortgage that was taken out on this home.
Original Mortgage
$289,656
Outstanding Balance
$201,909
Interest Rate
3.5%
Mortgage Type
FHA
Estimated Equity
$184,126
Purchase Details
Closed on
Dec 19, 2011
Sold by
Chicago Title Land Trust Company
Bought by
Plewa Marian and Plewa Maria
Purchase Details
Closed on
Aug 2, 2011
Sold by
Heim Sharmon H
Bought by
Chicago Title Land Trust Company and Trust #8002357604
Purchase Details
Closed on
Jan 12, 1995
Sold by
Heim Sharmon H and Heim Stephen
Bought by
Heim Sharmon H and Heim Steve
Create a Home Valuation Report for This Property
The Home Valuation Report is an in-depth analysis detailing your home's value as well as a comparison with similar homes in the area
Home Values in the Area
Average Home Value in this Area
Purchase History
| Date | Buyer | Sale Price | Title Company |
|---|---|---|---|
| Lynch Ryan P | $295,000 | None Available | |
| Plewa Marian | $85,000 | Chicago Title Land Trust Co | |
| Chicago Title Land Trust Company | $64,000 | Old Republic National Title | |
| Heim Sharmon H | -- | -- |
Source: Public Records
Mortgage History
| Date | Status | Borrower | Loan Amount |
|---|---|---|---|
| Open | Lynch Ryan P | $289,656 |
Source: Public Records
Tax History Compared to Growth
Tax History
| Year | Tax Paid | Tax Assessment Tax Assessment Total Assessment is a certain percentage of the fair market value that is determined by local assessors to be the total taxable value of land and additions on the property. | Land | Improvement |
|---|---|---|---|---|
| 2024 | $4,812 | $30,000 | $9,310 | $20,690 |
| 2023 | $4,670 | $26,001 | $8,313 | $17,688 |
| 2022 | $4,670 | $26,001 | $8,313 | $17,688 |
| 2021 | $4,558 | $25,999 | $8,312 | $17,687 |
| 2020 | $4,503 | $23,184 | $6,650 | $16,534 |
| 2019 | $4,515 | $25,760 | $6,650 | $19,110 |
| 2018 | $4,438 | $25,760 | $6,650 | $19,110 |
| 2017 | $4,895 | $25,964 | $5,985 | $19,979 |
| 2016 | $4,731 | $25,964 | $5,985 | $19,979 |
| 2015 | $4,792 | $25,964 | $5,985 | $19,979 |
| 2014 | $3,205 | $17,138 | $5,652 | $11,486 |
| 2013 | $3,142 | $17,138 | $5,652 | $11,486 |
Source: Public Records
Map
Nearby Homes
- 5427 S Newcastle Ave
- 5415 S Oak Park Ave
- 5359 S Nordica Ave
- 5148 S Newland Ave
- 5520 S New England Ave
- 5532 S Oak Park Ave
- 5137 S Rutherford Ave
- 5536 S Normandy Ave
- 5622 S Oak Park Ave
- 5605 S Nordica Ave
- 5112 S Nashville Ave
- 5653 S Normandy Ave
- 5637 S Natoma Ave
- 5326 S Nagle Ave
- 5250 S Nagle Ave
- 5733 S New England Ave
- 7235 Park Ave
- 5745 S Sayre Ave
- 5248 S Narragansett Ave
- 5402 S 73rd Ave
- 5340 S Newcastle Ave
- 5350 S Newcastle Ave
- 5336 S Newcastle Ave
- 5352 S Newcastle Ave
- 5334 S Newcastle Ave
- 5358 S Newcastle Ave
- 5345 S New England Ave
- 5343 S New England Ave
- 5349 S New England Ave
- 5337 S New England Ave
- 5353 S New England Ave
- 5330 S Newcastle Ave
- 5333 S New England Ave
- 5326 S Newcastle Ave
- 5357 S New England Ave
- 5347 S Newcastle Ave
- 5343 S Newcastle Ave
- 5351 S Newcastle Ave
- 5339 S Newcastle Ave
- 5355 S Newcastle Ave