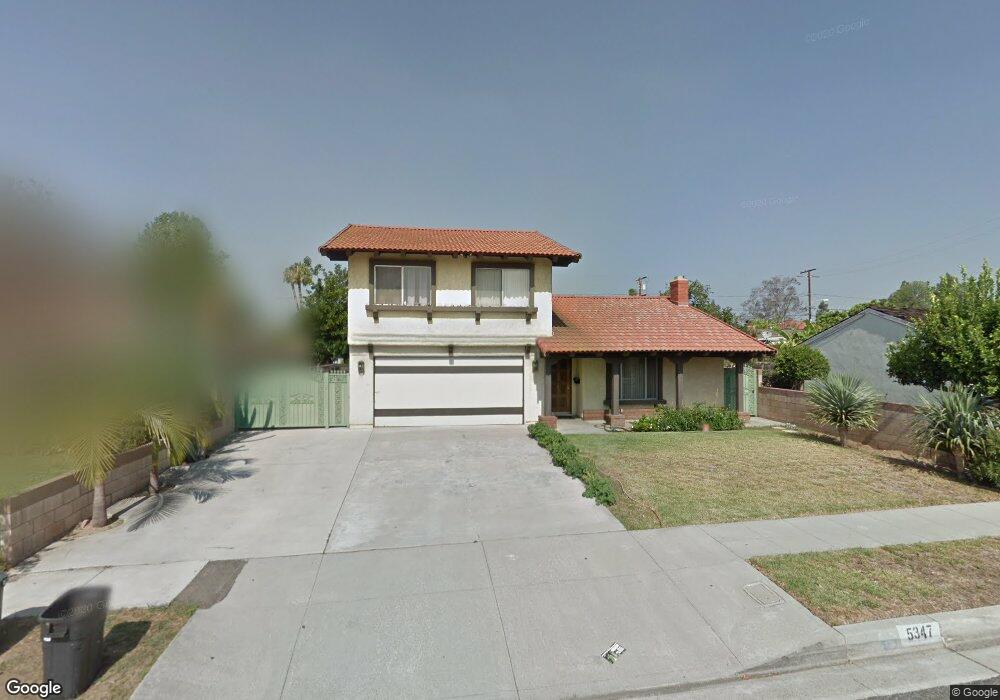
5347 Encinita Ave Temple City, CA 91780
Estimated Value: $1,292,567 - $1,633,000
4
Beds
4
Baths
2,487
Sq Ft
$591/Sq Ft
Est. Value
About This Home
This home is located at 5347 Encinita Ave, Temple City, CA 91780 and is currently estimated at $1,470,892, approximately $591 per square foot. 5347 Encinita Ave is a home located in Los Angeles County with nearby schools including La Rosa Elementary, Oak Avenue Intermediate School, and Temple City High School.
Ownership History
Date
Name
Owned For
Owner Type
Purchase Details
Closed on
Sep 19, 2016
Sold by
Quach Paul
Bought by
Quach Paul and Ngoy Hong Huy
Current Estimated Value
Home Financials for this Owner
Home Financials are based on the most recent Mortgage that was taken out on this home.
Original Mortgage
$380,000
Outstanding Balance
$303,529
Interest Rate
3.43%
Mortgage Type
New Conventional
Estimated Equity
$1,167,363
Purchase Details
Closed on
Feb 11, 2002
Sold by
Benton Robert Ray and Benton Susan Anita
Bought by
Quach Paul
Home Financials for this Owner
Home Financials are based on the most recent Mortgage that was taken out on this home.
Original Mortgage
$257,000
Interest Rate
6.99%
Purchase Details
Closed on
Jul 30, 1996
Sold by
Benton Robert R
Bought by
Benton Robert Ray and Benton Susan Anita
Create a Home Valuation Report for This Property
The Home Valuation Report is an in-depth analysis detailing your home's value as well as a comparison with similar homes in the area
Home Values in the Area
Average Home Value in this Area
Purchase History
| Date | Buyer | Sale Price | Title Company |
|---|---|---|---|
| Quach Paul | -- | Title 365 | |
| Quach Paul | $429,000 | Orange Coast Title | |
| Benton Robert Ray | -- | -- |
Source: Public Records
Mortgage History
| Date | Status | Borrower | Loan Amount |
|---|---|---|---|
| Open | Quach Paul | $380,000 | |
| Closed | Quach Paul | $257,000 |
Source: Public Records
Tax History Compared to Growth
Tax History
| Year | Tax Paid | Tax Assessment Tax Assessment Total Assessment is a certain percentage of the fair market value that is determined by local assessors to be the total taxable value of land and additions on the property. | Land | Improvement |
|---|---|---|---|---|
| 2025 | $8,062 | $780,617 | $327,801 | $452,816 |
| 2024 | $8,062 | $663,744 | $321,374 | $342,370 |
| 2023 | $7,880 | $650,730 | $315,073 | $335,657 |
| 2022 | $6,940 | $597,188 | $308,896 | $288,292 |
| 2021 | $7,059 | $585,480 | $302,840 | $282,640 |
| 2019 | $6,807 | $568,115 | $293,858 | $274,257 |
| 2018 | $6,618 | $556,977 | $288,097 | $268,880 |
| 2016 | $6,333 | $535,351 | $276,911 | $258,440 |
| 2015 | $6,226 | $527,310 | $272,752 | $254,558 |
| 2014 | $6,136 | $516,982 | $267,410 | $249,572 |
Source: Public Records
Map
Nearby Homes
- 9134 Rancho Real Rd
- 9224 Pentland St
- 9409 Olive St
- 5463 Sultana Ave
- 5327 Buttons Ave
- 5241 Rosemead Blvd Unit B
- 5530 Alessandro Ave
- 9406 La Rosa Dr
- 4917 Encinita Ave
- 5619 Sultana Ave Unit A
- 5635 Noel Dr
- 5143 Acacia St
- 9063 Evansport Dr
- 4850 Heleo Ave
- 5032 Fiesta Ave
- 0 Sultana Ave
- 8739 E Sienna Ln
- 1281 E Broadway
- 5823 Myda Ave
- 4840 Temple City Blvd
- 9154 Olive St
- 5341 Encinita Ave
- 9166 Olive St
- 9160 Olive St
- 9150 Olive St
- 5333 Encinita Ave
- 5331 Encinita Ave
- 5354 Loma Ave
- 9146 Olive St
- 5350 Encinita Ave
- 5327 Encinita Ave
- 5360 Loma Ave
- 5346 Loma Ave
- 9206 Olive St
- 5405 Encinita Ave
- 9140 Olive St
- 9155 Olive St
- 5340 Encinita Ave
- 5340 Loma Ave
- 5323 Encinita Ave