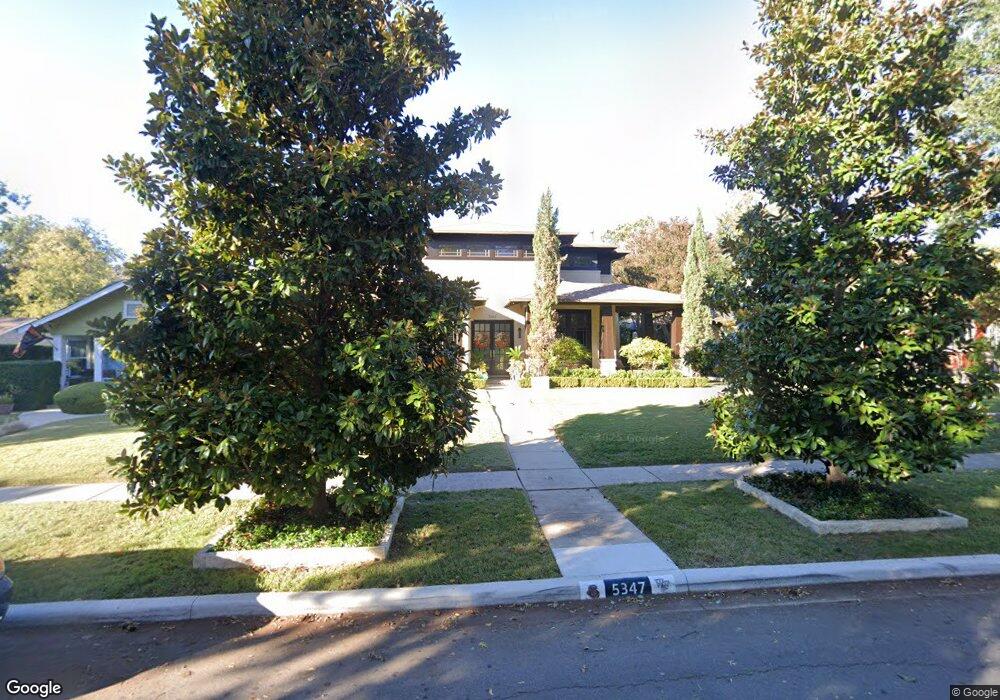
5347 Vickery Blvd Dallas, TX 75206
Lower Greenville NeighborhoodEstimated Value: $1,428,000 - $1,637,848
3
Beds
4
Baths
3,862
Sq Ft
$401/Sq Ft
Est. Value
About This Home
This home is located at 5347 Vickery Blvd, Dallas, TX 75206 and is currently estimated at $1,547,962, approximately $400 per square foot. 5347 Vickery Blvd is a home located in Dallas County with nearby schools including J L Long Middle School, Woodrow Wilson High School, and The Saint Timothy School.
Ownership History
Date
Name
Owned For
Owner Type
Purchase Details
Closed on
Dec 9, 2013
Sold by
Froehlich Blake and Froelich Angela
Bought by
Theilken Luke S and Degarmo Noah C
Current Estimated Value
Home Financials for this Owner
Home Financials are based on the most recent Mortgage that was taken out on this home.
Original Mortgage
$632,000
Outstanding Balance
$473,525
Interest Rate
3.87%
Mortgage Type
Adjustable Rate Mortgage/ARM
Estimated Equity
$1,074,437
Purchase Details
Closed on
May 28, 2010
Sold by
Thomas William M and Thomas Jay S
Bought by
Froehlich Blake
Home Financials for this Owner
Home Financials are based on the most recent Mortgage that was taken out on this home.
Original Mortgage
$639,950
Interest Rate
5.87%
Mortgage Type
Construction
Purchase Details
Closed on
Nov 24, 2009
Sold by
Elliott Dean and Wielgosz Cynthia
Bought by
Thomas William M and Thomas Jay S
Purchase Details
Closed on
May 25, 2006
Sold by
Hudson William M and Perna Nancy
Bought by
Elliott Dean and Wielgosz Cynthia
Create a Home Valuation Report for This Property
The Home Valuation Report is an in-depth analysis detailing your home's value as well as a comparison with similar homes in the area
Home Values in the Area
Average Home Value in this Area
Purchase History
| Date | Buyer | Sale Price | Title Company |
|---|---|---|---|
| Theilken Luke S | -- | Cttx | |
| Froehlich Blake | -- | Rtt | |
| Thomas William M | -- | Rtt | |
| Elliott Dean | -- | Reunion Title |
Source: Public Records
Mortgage History
| Date | Status | Borrower | Loan Amount |
|---|---|---|---|
| Open | Theilken Luke S | $632,000 | |
| Previous Owner | Froehlich Blake | $639,950 |
Source: Public Records
Tax History Compared to Growth
Tax History
| Year | Tax Paid | Tax Assessment Tax Assessment Total Assessment is a certain percentage of the fair market value that is determined by local assessors to be the total taxable value of land and additions on the property. | Land | Improvement |
|---|---|---|---|---|
| 2025 | $23,502 | $1,439,290 | $714,000 | $725,290 |
| 2024 | $23,502 | $1,439,290 | $714,000 | $725,290 |
| 2023 | $23,502 | $1,487,620 | $612,000 | $875,620 |
| 2022 | $29,913 | $1,196,340 | $408,000 | $788,340 |
| 2021 | $25,722 | $975,060 | $408,000 | $567,060 |
| 2020 | $26,452 | $975,060 | $408,000 | $567,060 |
| 2019 | $22,273 | $975,060 | $0 | $0 |
| 2018 | $23,218 | $975,060 | $408,000 | $567,060 |
| 2017 | $25,571 | $940,350 | $306,000 | $634,350 |
| 2016 | $25,571 | $940,350 | $306,000 | $634,350 |
| 2015 | $18,504 | $805,000 | $224,400 | $580,600 |
| 2014 | $18,504 | $805,000 | $224,400 | $580,600 |
Source: Public Records
Map
Nearby Homes
- 5322 Miller Ave
- 5419 Vanderbilt Ave
- 5230 Vickery Blvd
- 5335 Richard Ave
- 5535 Willis Ave
- 5135 Vickery Blvd Unit A
- 5230 Richard Ave
- 5407 Merrimac Ave
- 5242 Merrimac Ave
- 5206 Monticello Ave
- 5438 Bonita Ave
- 2626 Madera St
- 5448 Bonita Ave
- 5220 Bonita Ave
- 5410 Belmont Ave
- 5016 Vickery Blvd
- 5419 Richmond Ave
- 5422 Morningside Ave
- 5630 Willis Ave
- 5627 Richard Ave
- 5351 Vickery Blvd
- 5343 Vickery Blvd
- 5339 Vickery Blvd
- 5357 Vickery Blvd
- 5335 Vickery Blvd
- 5346 Goodwin Ave
- 5342 Goodwin Ave
- 5342 Goodwin Ave Unit B
- 5348 Goodwin Ave
- 5331 Vickery Blvd
- 5403 Vickery Blvd
- 5338 Goodwin Ave
- 5344 Goodwin Ave
- 5354 Goodwin Ave
- 5346 Vickery Blvd
- 5350 Vickery Blvd
- 5342 Vickery Blvd
- 5334 Goodwin Ave
- 5354 Vickery Blvd
- 5336 Vickery Blvd