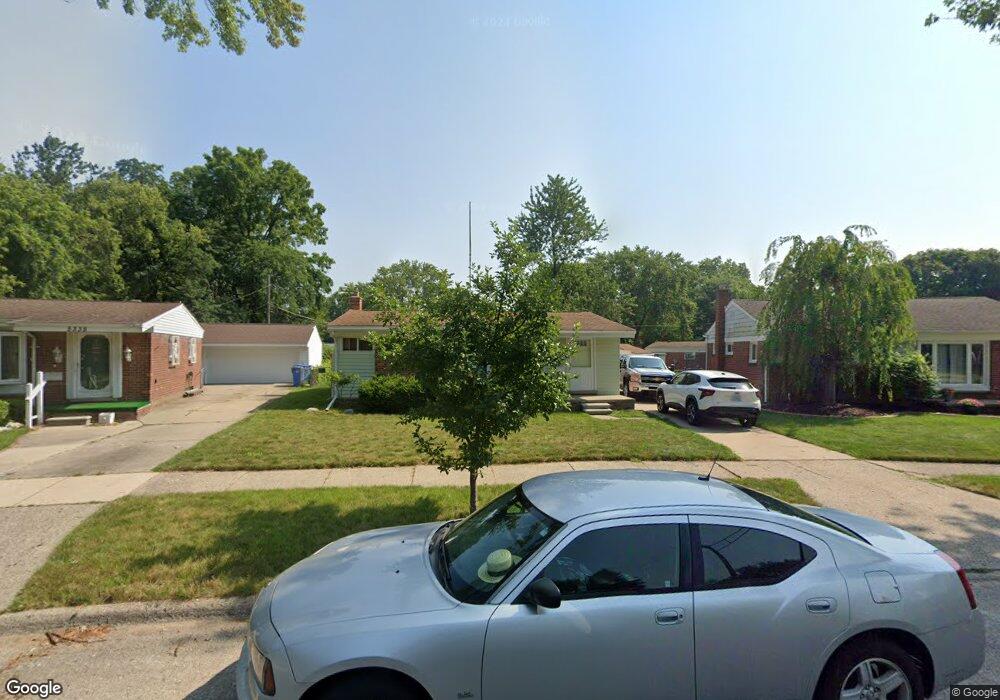
5347 Vivian St Dearborn Heights, MI 48125
Estimated Value: $161,000 - $187,000
3
Beds
2
Baths
1,015
Sq Ft
$170/Sq Ft
Est. Value
About This Home
This home is located at 5347 Vivian St, Dearborn Heights, MI 48125 and is currently estimated at $172,823, approximately $170 per square foot. 5347 Vivian St is a home located in Wayne County with nearby schools including Quest Charter Academy, West Village Academy, and Peterson-Warren Academy.
Ownership History
Date
Name
Owned For
Owner Type
Purchase Details
Closed on
Aug 4, 2025
Sold by
Williams Daniel David
Bought by
Williams Daniel David and Williams Dustin Daniel
Current Estimated Value
Purchase Details
Closed on
Jan 15, 2015
Sold by
Williams Daniel and Williams Shari
Bought by
Williams Daniel
Purchase Details
Closed on
Feb 10, 2011
Sold by
Vassel Patricia C
Bought by
Williams Daniel and Williams Shari
Home Financials for this Owner
Home Financials are based on the most recent Mortgage that was taken out on this home.
Original Mortgage
$15,000
Interest Rate
4.78%
Mortgage Type
Seller Take Back
Purchase Details
Closed on
Jul 18, 2009
Sold by
Maciborski Stanley and Maciborski Clara Tillie
Bought by
Maciborski Stanley and The Stanley Maciborski Living Trust
Purchase Details
Closed on
Apr 1, 2009
Sold by
Vassel Patricia C and Stanley Maciborski Living Trus
Bought by
Vassel Patricia C
Create a Home Valuation Report for This Property
The Home Valuation Report is an in-depth analysis detailing your home's value as well as a comparison with similar homes in the area
Home Values in the Area
Average Home Value in this Area
Purchase History
| Date | Buyer | Sale Price | Title Company |
|---|---|---|---|
| Williams Daniel David | -- | None Listed On Document | |
| Williams Daniel | -- | Title One Inc | |
| Williams Daniel | $51,000 | Title One Inc | |
| Williams Daniel | $51,000 | Title One Inc | |
| Maciborski Stanley | -- | None Available | |
| Vassel Patricia C | -- | None Available |
Source: Public Records
Mortgage History
| Date | Status | Borrower | Loan Amount |
|---|---|---|---|
| Previous Owner | Williams Daniel | $15,000 |
Source: Public Records
Tax History Compared to Growth
Tax History
| Year | Tax Paid | Tax Assessment Tax Assessment Total Assessment is a certain percentage of the fair market value that is determined by local assessors to be the total taxable value of land and additions on the property. | Land | Improvement |
|---|---|---|---|---|
| 2025 | $1,682 | $80,200 | $0 | $0 |
| 2024 | $1,682 | $78,200 | $0 | $0 |
| 2023 | $1,511 | $69,900 | $0 | $0 |
| 2022 | $2,048 | $60,000 | $0 | $0 |
| 2021 | $2,051 | $50,500 | $0 | $0 |
| 2019 | $1,870 | $42,500 | $0 | $0 |
| 2018 | $1,308 | $39,100 | $0 | $0 |
| 2017 | $1,026 | $38,800 | $0 | $0 |
| 2016 | $1,777 | $39,400 | $0 | $0 |
| 2015 | $3,670 | $36,700 | $0 | $0 |
| 2013 | $3,810 | $39,000 | $0 | $0 |
| 2010 | -- | $39,900 | $0 | $0 |
Source: Public Records
Map
Nearby Homes
- 5118 Michael St
- 4856 Carolee Ln
- 25474 McDonald St
- 25628 Powers Ave
- 24754 Annapolis St
- 25243 Lehigh St
- 24727 Hopkins St
- 25212 Lehigh St
- 25118 Lehigh St
- 24443 Powers Ave
- 5842 Janet St
- 5963 Vivian St
- 25926 Powers Ave
- 24360 Pennie St
- 5904 Janet St
- 4147 Westlake St
- 6020 Vivian St
- 25895 Annapolis St
- 5845 Beech Daly Rd
- 25085 Colgate St
- 5359 Vivian St
- 5335 Vivian St
- 25248 Powers Ave
- 5172 Cherokee St
- 5160 Cherokee St
- 5367 Vivian St
- 5321 Vivian St
- 5302 Cherokee St
- 5148 Cherokee St
- 5136 Cherokee St
- 5314 Cherokee St
- 5340 Vivian St
- 5379 Vivian St
- 5372 Vivian St
- 5124 Cherokee St
- 5145 Michael St
- 5135 Michael St
- 5322 Cherokee St
- 5125 Michael St
- 25221 Pennie St