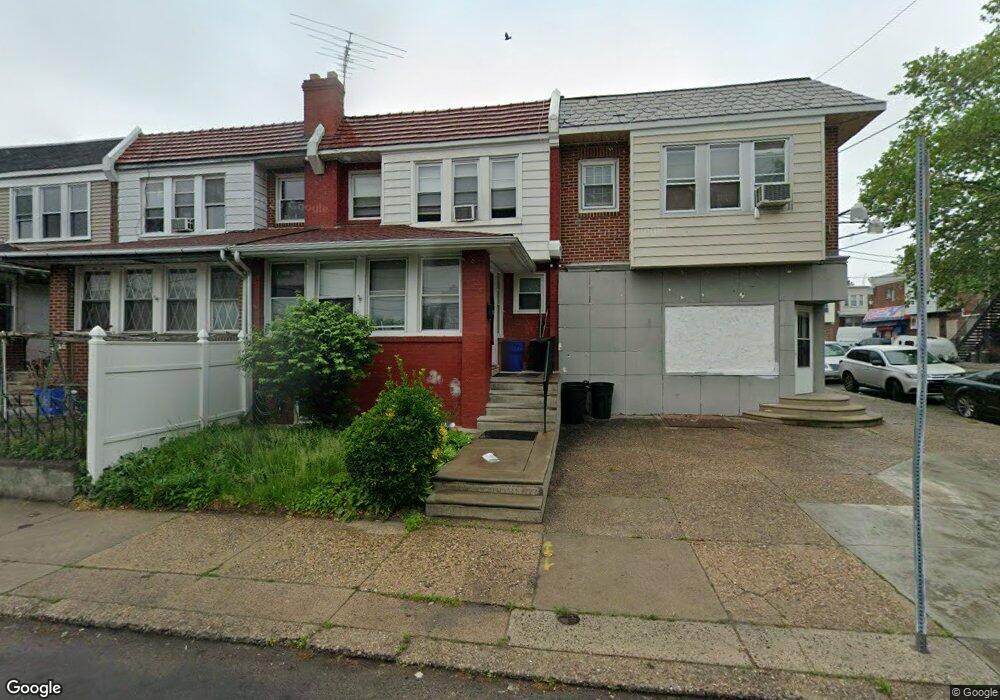
5348 Saul St Philadelphia, PA 19124
Frankford NeighborhoodEstimated Value: $201,000 - $223,000
3
Beds
1
Bath
1,280
Sq Ft
$166/Sq Ft
Est. Value
About This Home
This home is located at 5348 Saul St, Philadelphia, PA 19124 and is currently estimated at $212,018, approximately $165 per square foot. 5348 Saul St is a home located in Philadelphia County with nearby schools including Frankford High School, The Philadelphia Charter School for the Arts & Sciences, and Mastery Schools Smedley Elementary.
Ownership History
Date
Name
Owned For
Owner Type
Purchase Details
Closed on
Feb 28, 2001
Sold by
Keenehan Daniel J and Keenehan Margaret M
Bought by
Hernandez Olga
Current Estimated Value
Home Financials for this Owner
Home Financials are based on the most recent Mortgage that was taken out on this home.
Original Mortgage
$55,520
Outstanding Balance
$19,577
Interest Rate
6.93%
Mortgage Type
FHA
Estimated Equity
$192,441
Purchase Details
Closed on
Apr 4, 1996
Sold by
Schlechter Margaret M and Simpkins Margaret
Bought by
Keenehan Daniel J and Keenehan Margaret M
Create a Home Valuation Report for This Property
The Home Valuation Report is an in-depth analysis detailing your home's value as well as a comparison with similar homes in the area
Home Values in the Area
Average Home Value in this Area
Purchase History
| Date | Buyer | Sale Price | Title Company |
|---|---|---|---|
| Hernandez Olga | $56,000 | -- | |
| Keenehan Daniel J | $54,200 | -- |
Source: Public Records
Mortgage History
| Date | Status | Borrower | Loan Amount |
|---|---|---|---|
| Open | Hernandez Olga | $55,520 |
Source: Public Records
Tax History Compared to Growth
Tax History
| Year | Tax Paid | Tax Assessment Tax Assessment Total Assessment is a certain percentage of the fair market value that is determined by local assessors to be the total taxable value of land and additions on the property. | Land | Improvement |
|---|---|---|---|---|
| 2026 | $1,960 | $172,100 | $34,420 | $137,680 |
| 2025 | $1,960 | $172,100 | $34,420 | $137,680 |
| 2024 | $1,960 | $172,100 | $34,420 | $137,680 |
| 2023 | $1,960 | $140,000 | $28,000 | $112,000 |
| 2022 | $791 | $95,000 | $28,000 | $67,000 |
| 2021 | $1,421 | $0 | $0 | $0 |
| 2020 | $1,421 | $0 | $0 | $0 |
| 2019 | $1,363 | $0 | $0 | $0 |
| 2018 | $1,328 | $0 | $0 | $0 |
| 2017 | $1,328 | $0 | $0 | $0 |
| 2016 | $908 | $0 | $0 | $0 |
| 2015 | $870 | $0 | $0 | $0 |
| 2014 | -- | $94,900 | $19,799 | $75,101 |
| 2012 | -- | $12,064 | $1,425 | $10,639 |
Source: Public Records
Map
Nearby Homes