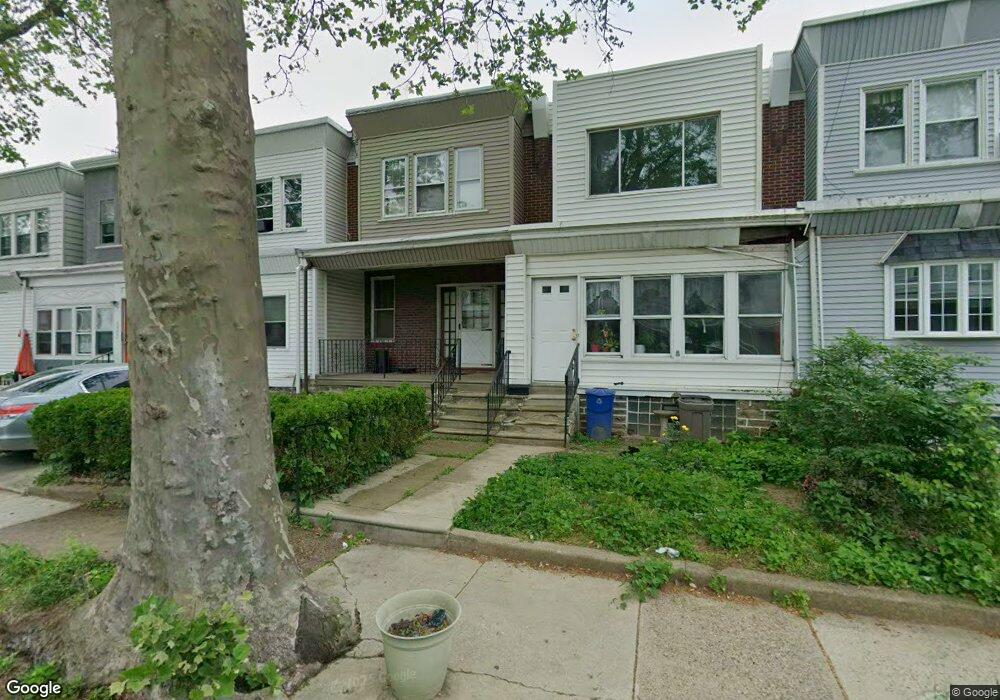
5349 Akron St Philadelphia, PA 19124
Frankford NeighborhoodEstimated Value: $195,000 - $217,000
3
Beds
1
Bath
1,230
Sq Ft
$167/Sq Ft
Est. Value
About This Home
This home is located at 5349 Akron St, Philadelphia, PA 19124 and is currently estimated at $205,237, approximately $166 per square foot. 5349 Akron St is a home located in Philadelphia County with nearby schools including Frankford High School, The Philadelphia Charter School for the Arts & Sciences, and Mastery Schools Smedley Elementary.
Ownership History
Date
Name
Owned For
Owner Type
Purchase Details
Closed on
Apr 29, 2004
Sold by
Effing Richard C and Effing Marie H
Bought by
Coe Janice
Current Estimated Value
Home Financials for this Owner
Home Financials are based on the most recent Mortgage that was taken out on this home.
Original Mortgage
$69,000
Outstanding Balance
$32,428
Interest Rate
5.75%
Mortgage Type
FHA
Estimated Equity
$172,809
Create a Home Valuation Report for This Property
The Home Valuation Report is an in-depth analysis detailing your home's value as well as a comparison with similar homes in the area
Home Values in the Area
Average Home Value in this Area
Purchase History
| Date | Buyer | Sale Price | Title Company |
|---|---|---|---|
| Coe Janice | $71,000 | -- |
Source: Public Records
Mortgage History
| Date | Status | Borrower | Loan Amount |
|---|---|---|---|
| Open | Coe Janice | $69,000 |
Source: Public Records
Tax History Compared to Growth
Tax History
| Year | Tax Paid | Tax Assessment Tax Assessment Total Assessment is a certain percentage of the fair market value that is determined by local assessors to be the total taxable value of land and additions on the property. | Land | Improvement |
|---|---|---|---|---|
| 2026 | $1,908 | $168,400 | $33,680 | $134,720 |
| 2025 | $1,908 | $168,400 | $33,680 | $134,720 |
| 2024 | $1,908 | $168,400 | $33,680 | $134,720 |
| 2023 | $1,908 | $136,300 | $27,260 | $109,040 |
| 2022 | $732 | $91,300 | $27,260 | $64,040 |
| 2021 | $1,362 | $0 | $0 | $0 |
| 2020 | $1,362 | $0 | $0 | $0 |
| 2019 | $1,307 | $0 | $0 | $0 |
| 2018 | $1,305 | $0 | $0 | $0 |
| 2017 | $1,305 | $0 | $0 | $0 |
| 2016 | $885 | $0 | $0 | $0 |
| 2015 | $847 | $0 | $0 | $0 |
| 2014 | -- | $93,200 | $15,095 | $78,105 |
| 2012 | -- | $11,936 | $1,067 | $10,869 |
Source: Public Records
Map
Nearby Homes