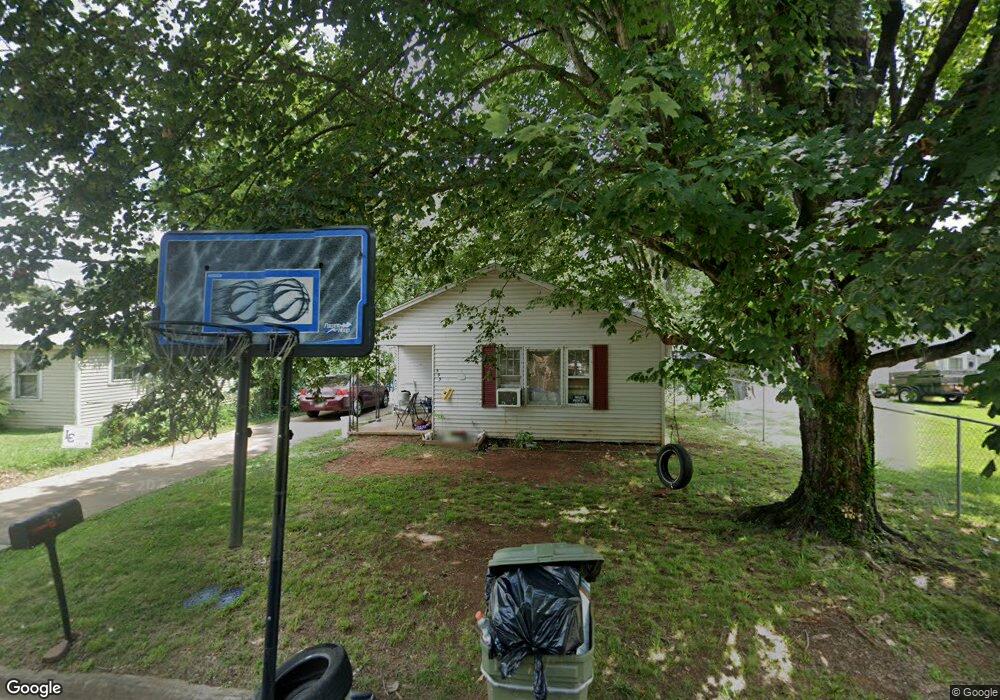
535 4th St Lawrenceburg, TN 38464
Estimated Value: $106,998 - $177,000
--
Bed
1
Bath
1,146
Sq Ft
$125/Sq Ft
Est. Value
About This Home
This home is located at 535 4th St, Lawrenceburg, TN 38464 and is currently estimated at $143,500, approximately $125 per square foot. 535 4th St is a home located in Lawrence County with nearby schools including Ingram Sowell Elementary School, Lawrenceburg Public Elementary School, and David Crockett Elementary School.
Ownership History
Date
Name
Owned For
Owner Type
Purchase Details
Closed on
Mar 12, 2003
Sold by
Swartz & Brough Inc
Bought by
Shirley Clark
Current Estimated Value
Home Financials for this Owner
Home Financials are based on the most recent Mortgage that was taken out on this home.
Original Mortgage
$26,000
Outstanding Balance
$11,078
Interest Rate
5.88%
Estimated Equity
$132,422
Purchase Details
Closed on
Nov 22, 2002
Sold by
Bank Of America
Bought by
Swartz & Brough Inc
Purchase Details
Closed on
Apr 23, 2002
Bought by
Bank Of America
Purchase Details
Closed on
Jun 20, 1990
Bought by
Newell Saundra L
Purchase Details
Closed on
Nov 29, 1988
Bought by
Cook Charles and Benita Faulk
Purchase Details
Closed on
Mar 17, 1978
Bought by
Cook Lazelle L
Create a Home Valuation Report for This Property
The Home Valuation Report is an in-depth analysis detailing your home's value as well as a comparison with similar homes in the area
Home Values in the Area
Average Home Value in this Area
Purchase History
| Date | Buyer | Sale Price | Title Company |
|---|---|---|---|
| Shirley Clark | $26,000 | -- | |
| Swartz & Brough Inc | $18,000 | -- | |
| Bank Of America | $37,000 | -- | |
| Newell Saundra L | -- | -- | |
| Cook Charles | -- | -- | |
| Cook Lazelle L | -- | -- |
Source: Public Records
Mortgage History
| Date | Status | Borrower | Loan Amount |
|---|---|---|---|
| Open | Cook Lazelle L | $26,000 |
Source: Public Records
Tax History Compared to Growth
Tax History
| Year | Tax Paid | Tax Assessment Tax Assessment Total Assessment is a certain percentage of the fair market value that is determined by local assessors to be the total taxable value of land and additions on the property. | Land | Improvement |
|---|---|---|---|---|
| 2025 | $592 | $19,050 | $0 | $0 |
| 2024 | $592 | $19,050 | $1,500 | $17,550 |
| 2023 | $592 | $19,050 | $1,500 | $17,550 |
| 2022 | $592 | $19,050 | $1,500 | $17,550 |
| 2021 | $431 | $9,800 | $1,500 | $8,300 |
| 2020 | $431 | $9,800 | $1,500 | $8,300 |
| 2019 | $431 | $9,800 | $1,500 | $8,300 |
| 2018 | $431 | $9,800 | $1,500 | $8,300 |
| 2017 | $431 | $9,800 | $1,500 | $8,300 |
| 2016 | $431 | $9,800 | $1,500 | $8,300 |
| 2015 | $408 | $9,800 | $1,500 | $8,300 |
| 2014 | $416 | $10,000 | $1,500 | $8,500 |
Source: Public Records
Map
Nearby Homes