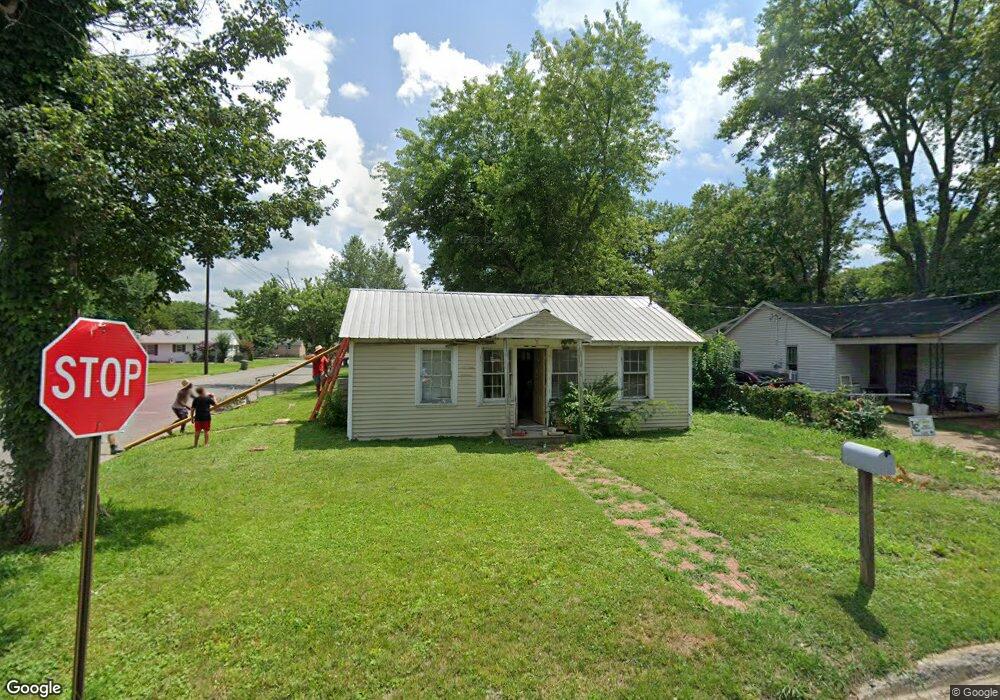
537 4th St Lawrenceburg, TN 38464
Estimated Value: $91,406 - $171,000
--
Bed
1
Bath
992
Sq Ft
$133/Sq Ft
Est. Value
About This Home
This home is located at 537 4th St, Lawrenceburg, TN 38464 and is currently estimated at $132,352, approximately $133 per square foot. 537 4th St is a home located in Lawrence County with nearby schools including Ingram Sowell Elementary School, Lawrenceburg Public Elementary School, and David Crockett Elementary School.
Ownership History
Date
Name
Owned For
Owner Type
Purchase Details
Closed on
Jan 25, 2016
Sold by
Englett Melissa Diane
Bought by
Englett James
Current Estimated Value
Purchase Details
Closed on
Jul 15, 2002
Sold by
Hollis Christopher M
Bought by
Diane Searle Melissa
Purchase Details
Closed on
Apr 28, 1992
Bought by
Hollis Christopher Michael
Purchase Details
Closed on
Aug 16, 1982
Bought by
Martin Louis E
Purchase Details
Closed on
Dec 29, 1975
Bought by
Martin Louis E
Purchase Details
Closed on
Dec 5, 1956
Bought by
Uselston Gladys Martin
Create a Home Valuation Report for This Property
The Home Valuation Report is an in-depth analysis detailing your home's value as well as a comparison with similar homes in the area
Home Values in the Area
Average Home Value in this Area
Purchase History
| Date | Buyer | Sale Price | Title Company |
|---|---|---|---|
| Englett James | -- | -- | |
| Diane Searle Melissa | $10,000 | -- | |
| Hollis Christopher Michael | $17,000 | -- | |
| Martin Louis E | -- | -- | |
| Martin Louis E | -- | -- | |
| Uselston Gladys Martin | -- | -- |
Source: Public Records
Tax History Compared to Growth
Tax History
| Year | Tax Paid | Tax Assessment Tax Assessment Total Assessment is a certain percentage of the fair market value that is determined by local assessors to be the total taxable value of land and additions on the property. | Land | Improvement |
|---|---|---|---|---|
| 2025 | $434 | $13,975 | $0 | $0 |
| 2024 | $434 | $13,975 | $1,250 | $12,725 |
| 2023 | $434 | $13,975 | $1,250 | $12,725 |
| 2022 | $434 | $13,975 | $1,250 | $12,725 |
| 2021 | $305 | $6,925 | $1,250 | $5,675 |
| 2020 | $305 | $6,925 | $1,250 | $5,675 |
| 2019 | $305 | $6,925 | $1,250 | $5,675 |
| 2018 | $305 | $6,925 | $1,250 | $5,675 |
| 2017 | $305 | $6,925 | $1,250 | $5,675 |
| 2016 | $305 | $6,925 | $1,250 | $5,675 |
| 2015 | $288 | $6,925 | $1,250 | $5,675 |
| 2014 | $257 | $6,175 | $1,250 | $4,925 |
Source: Public Records
Map
Nearby Homes