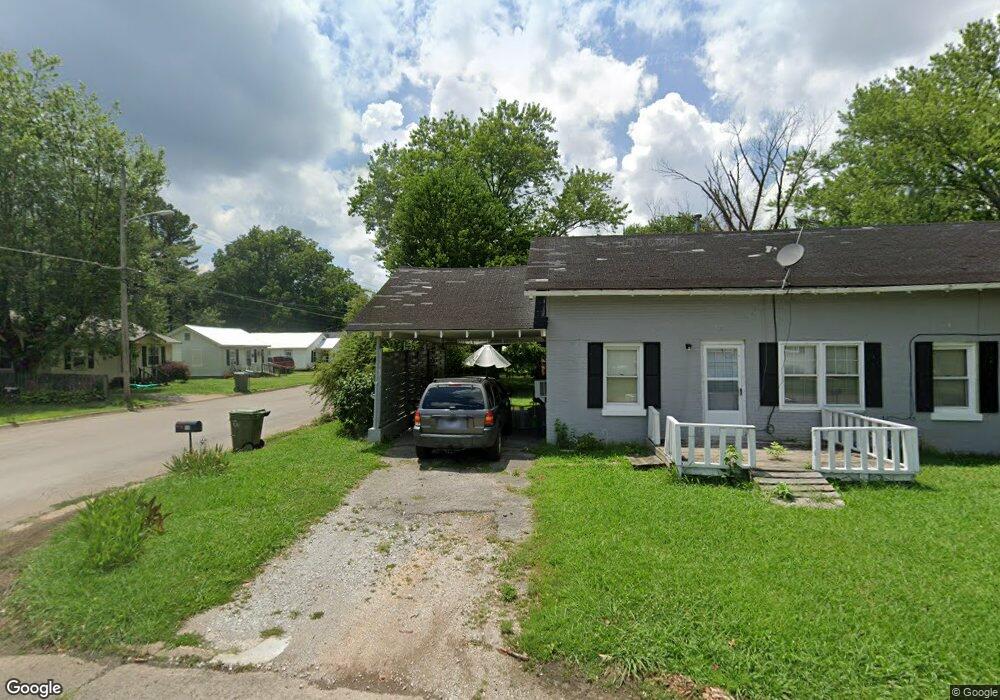
538 3rd St Lawrenceburg, TN 38464
Estimated Value: $120,429 - $246,000
--
Bed
2
Baths
1,657
Sq Ft
$100/Sq Ft
Est. Value
About This Home
This home is located at 538 3rd St, Lawrenceburg, TN 38464 and is currently estimated at $166,107, approximately $100 per square foot. 538 3rd St is a home located in Lawrence County with nearby schools including Ingram Sowell Elementary School, Lawrenceburg Public Elementary School, and David Crockett Elementary School.
Ownership History
Date
Name
Owned For
Owner Type
Purchase Details
Closed on
May 30, 2012
Sold by
The Bank Of Waynesboro
Bought by
Shook Randy and Shook Wanda
Current Estimated Value
Home Financials for this Owner
Home Financials are based on the most recent Mortgage that was taken out on this home.
Original Mortgage
$25,337
Outstanding Balance
$17,505
Interest Rate
3.84%
Mortgage Type
Commercial
Estimated Equity
$148,602
Purchase Details
Closed on
May 27, 2010
Sold by
Wallace Sheila
Bought by
The Bank Of Waynesboro
Purchase Details
Closed on
Jan 7, 2004
Sold by
Craig Dena P
Bought by
Sheila Wallace
Home Financials for this Owner
Home Financials are based on the most recent Mortgage that was taken out on this home.
Original Mortgage
$37,000
Interest Rate
6%
Purchase Details
Closed on
Aug 30, 1962
Bought by
Potter Mary C
Purchase Details
Closed on
Feb 14, 1949
Create a Home Valuation Report for This Property
The Home Valuation Report is an in-depth analysis detailing your home's value as well as a comparison with similar homes in the area
Home Values in the Area
Average Home Value in this Area
Purchase History
| Date | Buyer | Sale Price | Title Company |
|---|---|---|---|
| Shook Randy | $20,000 | -- | |
| The Bank Of Waynesboro | $45,000 | -- | |
| Sheila Wallace | $36,000 | -- | |
| Potter Mary C | -- | -- | |
| -- | -- | -- |
Source: Public Records
Mortgage History
| Date | Status | Borrower | Loan Amount |
|---|---|---|---|
| Open | Shook Randy | $25,337 | |
| Previous Owner | Not Available | $37,000 |
Source: Public Records
Tax History Compared to Growth
Tax History
| Year | Tax Paid | Tax Assessment Tax Assessment Total Assessment is a certain percentage of the fair market value that is determined by local assessors to be the total taxable value of land and additions on the property. | Land | Improvement |
|---|---|---|---|---|
| 2025 | $1,071 | $34,480 | $0 | $0 |
| 2024 | $1,071 | $34,480 | $4,000 | $30,480 |
| 2023 | $1,071 | $34,480 | $4,000 | $30,480 |
| 2022 | $1,071 | $34,480 | $4,000 | $30,480 |
| 2021 | $1,022 | $23,240 | $3,200 | $20,040 |
| 2020 | $1,022 | $23,240 | $3,200 | $20,040 |
| 2019 | $1,022 | $23,240 | $3,200 | $20,040 |
| 2018 | $1,022 | $23,240 | $3,200 | $20,040 |
| 2017 | $1,022 | $23,240 | $3,200 | $20,040 |
| 2016 | $1,022 | $23,240 | $3,200 | $20,040 |
| 2015 | $967 | $23,240 | $3,200 | $20,040 |
| 2014 | $1,016 | $24,400 | $3,200 | $21,200 |
Source: Public Records
Map
Nearby Homes