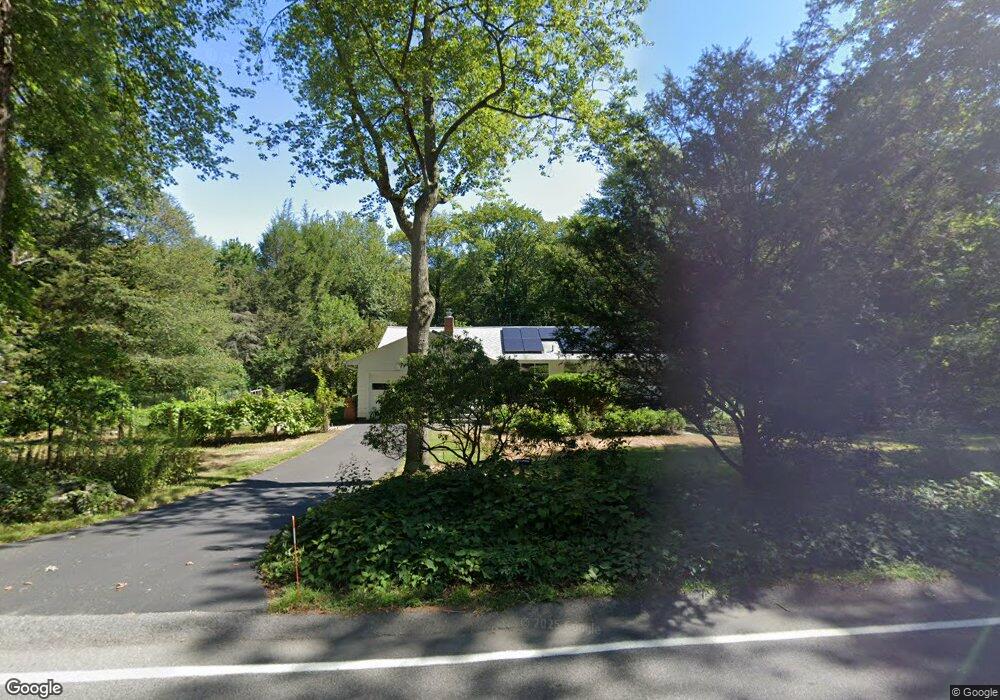
539 Cedar Ave East Greenwich, RI 02818
Glenwood NeighborhoodEstimated Value: $505,000 - $707,000
4
Beds
2
Baths
1,600
Sq Ft
$396/Sq Ft
Est. Value
About This Home
This home is located at 539 Cedar Ave, East Greenwich, RI 02818 and is currently estimated at $633,409, approximately $395 per square foot. 539 Cedar Ave is a home located in Kent County with nearby schools including Meadowbrook Farms Elementary School, George Hanaford School, and James H. Eldredge Elementary School.
Ownership History
Date
Name
Owned For
Owner Type
Purchase Details
Closed on
Mar 30, 2001
Sold by
Perry Leo E Est and Perry
Bought by
Robinson Paul A and Myers Marjory
Current Estimated Value
Home Financials for this Owner
Home Financials are based on the most recent Mortgage that was taken out on this home.
Original Mortgage
$83,000
Outstanding Balance
$29,711
Interest Rate
6.96%
Mortgage Type
Purchase Money Mortgage
Estimated Equity
$603,698
Create a Home Valuation Report for This Property
The Home Valuation Report is an in-depth analysis detailing your home's value as well as a comparison with similar homes in the area
Home Values in the Area
Average Home Value in this Area
Purchase History
| Date | Buyer | Sale Price | Title Company |
|---|---|---|---|
| Robinson Paul A | $229,500 | -- |
Source: Public Records
Mortgage History
| Date | Status | Borrower | Loan Amount |
|---|---|---|---|
| Open | Robinson Paul A | $83,000 |
Source: Public Records
Tax History Compared to Growth
Tax History
| Year | Tax Paid | Tax Assessment Tax Assessment Total Assessment is a certain percentage of the fair market value that is determined by local assessors to be the total taxable value of land and additions on the property. | Land | Improvement |
|---|---|---|---|---|
| 2025 | $7,200 | $462,400 | $217,600 | $244,800 |
| 2024 | $6,811 | $462,400 | $217,600 | $244,800 |
| 2023 | $7,359 | $336,800 | $189,200 | $147,600 |
| 2022 | $7,214 | $336,800 | $189,200 | $147,600 |
| 2021 | $7,076 | $336,800 | $189,200 | $147,600 |
| 2020 | $7,141 | $304,800 | $175,500 | $129,300 |
| 2019 | $7,074 | $304,800 | $175,500 | $129,300 |
| 2018 | $7,010 | $304,800 | $175,500 | $129,300 |
| 2017 | $6,899 | $291,600 | $182,800 | $108,800 |
| 2016 | $7,025 | $291,600 | $182,800 | $108,800 |
| 2015 | $6,783 | $291,600 | $182,800 | $108,800 |
| 2014 | $6,557 | $281,900 | $164,500 | $117,400 |
Source: Public Records
Map
Nearby Homes
- 584 Division St
- 181 Heritage Dr
- 199 1st Ave
- 44 Saddlebrook Dr
- 127 Prospect St
- 91 Cindyann Dr
- 58 Greene St
- 16 Shady Glen Dr
- 185 Joseph Ct
- 9 Joseph N Zenga Jr Blvd Unit 201
- 9 Joseph N Zenga Jr Blvd Unit 109
- 9 Joseph N Zenga Jr Blvd Unit 310
- 9 Joseph N Zenga Jr Blvd Unit 301
- 9 Joseph N Zenga Jr Blvd Unit 205
- 9 Joseph N Zenga Jr Blvd Unit 102
- 9 Joseph N Zenga Jr Blvd Unit 111
- 9 Joseph N Zenga Jr Blvd Unit 308
- 9 Joseph N Zenga Jr Blvd Unit 213
- 9 Joseph N Zenga Jr Blvd Unit 110
- 9 Joseph N Zenga Jr Blvd Unit 204