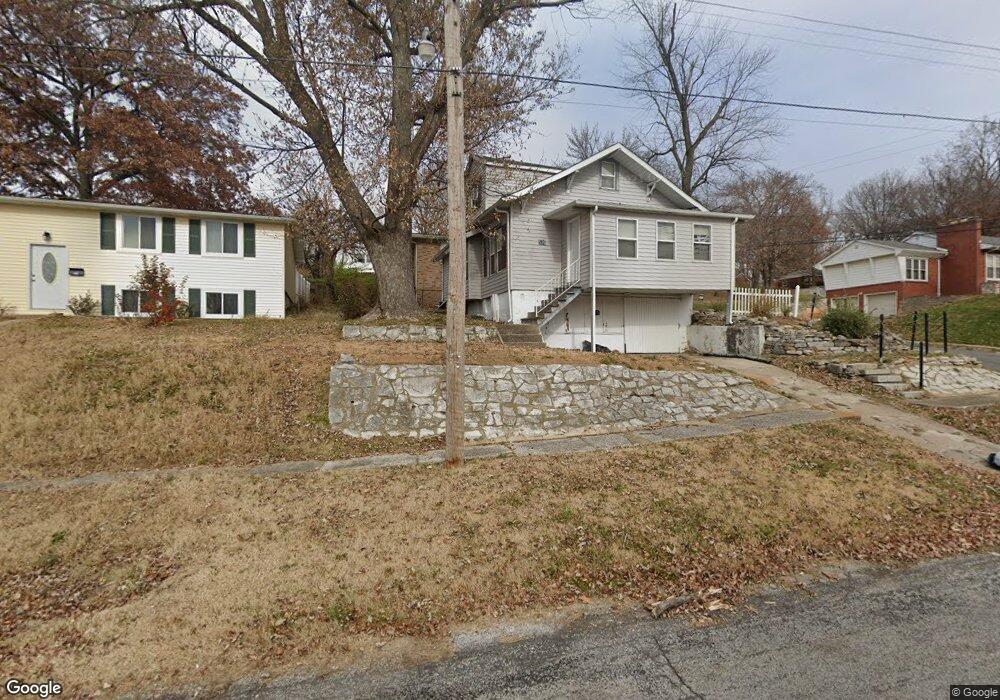
539 E Main St East Alton, IL 62024
Estimated Value: $87,000 - $134,000
3
Beds
2
Baths
1,209
Sq Ft
$89/Sq Ft
Est. Value
About This Home
This home is located at 539 E Main St, East Alton, IL 62024 and is currently estimated at $107,261, approximately $88 per square foot. 539 E Main St is a home located in Madison County with nearby schools including Eastwood Elementary School, East Alton Middle School, and East Alton-Wood River High School.
Ownership History
Date
Name
Owned For
Owner Type
Purchase Details
Closed on
Dec 23, 2013
Sold by
Mccann Shaun A and Mccann Jacqulyn S
Bought by
Mccann Shaun A and Mccann Jacqulyn S
Current Estimated Value
Home Financials for this Owner
Home Financials are based on the most recent Mortgage that was taken out on this home.
Original Mortgage
$68,891
Outstanding Balance
$52,174
Interest Rate
4.55%
Mortgage Type
New Conventional
Estimated Equity
$55,087
Purchase Details
Closed on
Apr 6, 2006
Sold by
Goodman Kevin W and Goodman Rebecka
Bought by
Mccann Shaun A and Colbert Jacqulyn S
Home Financials for this Owner
Home Financials are based on the most recent Mortgage that was taken out on this home.
Original Mortgage
$13,700
Interest Rate
6.33%
Mortgage Type
Stand Alone Second
Purchase Details
Closed on
Oct 4, 2004
Sold by
Green Tree Servicing Llc
Bought by
Goodman Kevin W and Goodman Rebecka
Purchase Details
Closed on
Dec 30, 2003
Sold by
Lamb Floyd C and Lamb Carolyn L
Bought by
Green Tree Servicing Llc
Create a Home Valuation Report for This Property
The Home Valuation Report is an in-depth analysis detailing your home's value as well as a comparison with similar homes in the area
Home Values in the Area
Average Home Value in this Area
Purchase History
| Date | Buyer | Sale Price | Title Company |
|---|---|---|---|
| Mccann Shaun A | -- | Lsi | |
| Mccann Shaun A | $68,500 | Community Title & Escrow Ltd | |
| Goodman Kevin W | $26,500 | Fatic | |
| Green Tree Servicing Llc | -- | -- |
Source: Public Records
Mortgage History
| Date | Status | Borrower | Loan Amount |
|---|---|---|---|
| Open | Mccann Shaun A | $68,891 | |
| Closed | Mccann Shaun A | $13,700 | |
| Closed | Mccann Shaun A | $54,800 |
Source: Public Records
Tax History Compared to Growth
Tax History
| Year | Tax Paid | Tax Assessment Tax Assessment Total Assessment is a certain percentage of the fair market value that is determined by local assessors to be the total taxable value of land and additions on the property. | Land | Improvement |
|---|---|---|---|---|
| 2024 | $1,549 | $21,120 | $3,740 | $17,380 |
| 2023 | $1,549 | $19,690 | $3,490 | $16,200 |
| 2022 | $1,430 | $18,170 | $3,220 | $14,950 |
| 2021 | $1,259 | $16,930 | $3,000 | $13,930 |
| 2020 | $1,196 | $16,310 | $2,890 | $13,420 |
| 2019 | $1,163 | $15,820 | $2,800 | $13,020 |
| 2018 | $1,127 | $15,030 | $2,660 | $12,370 |
| 2017 | $1,037 | $14,670 | $2,600 | $12,070 |
| 2016 | $1,014 | $14,670 | $2,600 | $12,070 |
| 2015 | $972 | $14,510 | $2,570 | $11,940 |
| 2014 | $972 | $14,510 | $2,570 | $11,940 |
| 2013 | $972 | $14,720 | $2,610 | $12,110 |
Source: Public Records
Map
Nearby Homes
- 225 Lakeside Ave
- 604 Wood River Ave
- 523 Lincoln Ave
- 615 Bowman Ave
- 420 Bowman Ave
- 523 Broadway
- 250 Hi Pointe Place
- 283 Hi Pointe Place
- 323 Church St
- 133 Lincoln Ave
- 304 W Main St
- 129 N Pence St
- 121 Whitelaw Ave
- 405 Dry St
- 104 Whitelaw Ave
- 98 Wood River Ave
- 109 S Shamrock St
- 345 Illinois Ave
- 959 Cedar Dr
- 209 Elble Ave
- 99 Tomlinson St
- 537 E Main St
- 533 E Main St
- 515 Oak St
- 101 Tomlinson St
- 529 E Main St
- 107 Tomlinson St
- 527 E Main St
- 512 Oak St
- 104 Cardot St
- 109 Tomlinson St
- 655 Berkshire Blvd
- 511 Oak St
- 111 Tomlinson St
- 106 Cardot St
- 110 Tomlinson St
- 521 E Main St
- 651 Berkshire Blvd
- 108 Cardot St
- 113 Tomlinson St