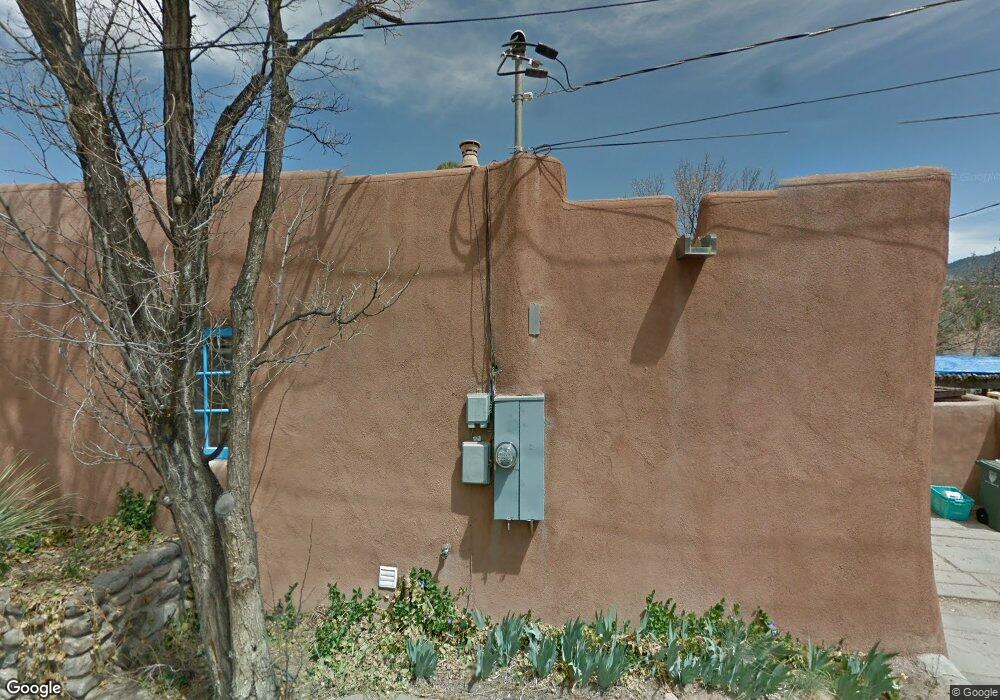
539 Hillside Ave Unit B Santa Fe, NM 87501
North Hills NeighborhoodEstimated Value: $431,000 - $671,673
1
Bed
1
Bath
663
Sq Ft
$870/Sq Ft
Est. Value
About This Home
This home is located at 539 Hillside Ave Unit B, Santa Fe, NM 87501 and is currently estimated at $576,918, approximately $870 per square foot. 539 Hillside Ave Unit B is a home located in Santa Fe County with nearby schools including Acequia Madre Elementary School, Santa Fe High School, and New Mexico School for the Arts.
Ownership History
Date
Name
Owned For
Owner Type
Purchase Details
Closed on
Oct 20, 2021
Sold by
Ferguson Robert L and Ferguson Kenneth B
Bought by
Arnold Katharine M
Current Estimated Value
Purchase Details
Closed on
Aug 15, 2019
Sold by
Mcmanis Scott W and Mcmanis Ann M
Bought by
Ferguson Robert L and Radke Kenneth B
Purchase Details
Closed on
Aug 27, 2013
Sold by
Heflin Clyde
Bought by
Mcmanis Scott W and Mcmanis Anna M
Home Financials for this Owner
Home Financials are based on the most recent Mortgage that was taken out on this home.
Original Mortgage
$189,000
Interest Rate
4.42%
Mortgage Type
New Conventional
Purchase Details
Closed on
Nov 19, 2001
Sold by
Gurule David D and Gurule Sharon K
Bought by
Heflin Clyde
Home Financials for this Owner
Home Financials are based on the most recent Mortgage that was taken out on this home.
Original Mortgage
$152,365
Interest Rate
6.54%
Create a Home Valuation Report for This Property
The Home Valuation Report is an in-depth analysis detailing your home's value as well as a comparison with similar homes in the area
Home Values in the Area
Average Home Value in this Area
Purchase History
| Date | Buyer | Sale Price | Title Company |
|---|---|---|---|
| Arnold Katharine M | -- | None Listed On Document | |
| Ferguson Robert L | -- | Santa Fe Title Company | |
| Mcmanis Scott W | -- | Fidelity National Title Of N | |
| Heflin Clyde | -- | -- |
Source: Public Records
Mortgage History
| Date | Status | Borrower | Loan Amount |
|---|---|---|---|
| Previous Owner | Mcmanis Scott W | $189,000 | |
| Previous Owner | Heflin Clyde | $152,365 |
Source: Public Records
Tax History Compared to Growth
Tax History
| Year | Tax Paid | Tax Assessment Tax Assessment Total Assessment is a certain percentage of the fair market value that is determined by local assessors to be the total taxable value of land and additions on the property. | Land | Improvement |
|---|---|---|---|---|
| 2024 | $3,188 | $418,290 | -- | $418,290 |
| 2023 | $3,188 | $406,107 | $0 | $406,107 |
| 2022 | $3,117 | $394,279 | $0 | $394,279 |
| 2021 | $2,900 | $120,567 | $0 | $120,567 |
| 2020 | $2,927 | $121,805 | $0 | $121,805 |
| 2019 | $1,864 | $76,376 | $0 | $76,376 |
| 2018 | $1,823 | $74,152 | $0 | $74,152 |
| 2017 | $1,777 | $71,992 | $0 | $71,992 |
| 2016 | $1,676 | $69,895 | $0 | $69,895 |
| 2015 | $1,637 | $67,860 | $0 | $67,860 |
| 2014 | $1,539 | $65,817 | $0 | $65,817 |
Source: Public Records
Map
Nearby Homes
- 220 Rodriguez St
- 629 E Palace Ave Unit 1
- 707 E Palace Ave Unit 8
- 707 E Palace Ave Unit 11
- 606 E Palace Ave
- 541 E Alameda St Unit B
- 637 E Alameda St
- 320 Artist Rd Unit 14
- 320 Artist Rd Unit 12
- 320 Artist Rd Unit 95
- 320 Artist Rd Unit 89
- 320 Artist Rd Unit 52
- 320 Artist Rd Unit 8
- 320 Artist Rd Unit 58
- 800 La Vereda Este
- 812 La Vereda Este
- 808 La Vereda Este
- 794 Calle Altamira
- 1713-C W Alameda St Unit C
- 614 E Alameda St
- 539 Hillside Ave Unit B
- 539 Hillside Ave Unit A
- 539 Hillside Ave Unit C
- 539 Hillside Ave
- 545 Hillside Ave
- 547 Hillside Ave
- 549 Hillside Ave
- 538 Hillside Ave
- 404 Calle Kokopelli
- 539 Armijo St
- 537 Hillside Ave
- 538 1/2 Hillside Ave
- 538 1/2 Hillside Ave
- 544 Hillside Ave
- 536 Hillside Ave
- 400 Calle Kokopelli
- 541 Hillside Ave
- 535 Hillside Ave
- 535 Hillside Ave
- 535 & 535 1/2 Hillside