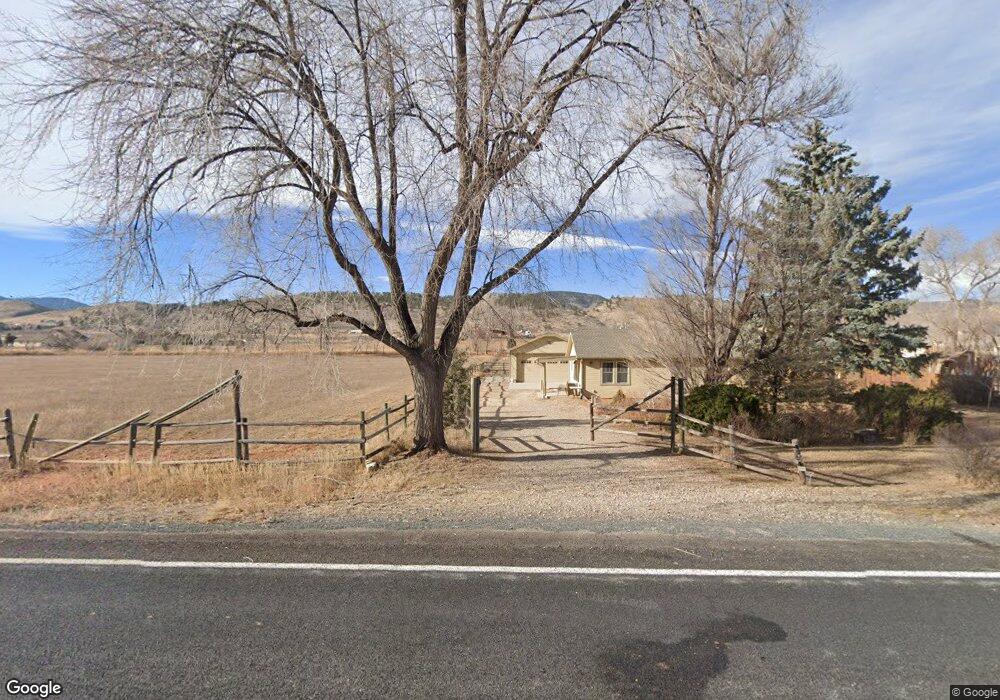
539 N County Road 29 Loveland, CO 80537
Estimated Value: $557,000 - $1,800,000
2
Beds
1
Bath
1,222
Sq Ft
$840/Sq Ft
Est. Value
About This Home
This home is located at 539 N County Road 29, Loveland, CO 80537 and is currently estimated at $1,027,029, approximately $840 per square foot. 539 N County Road 29 is a home located in Larimer County with nearby schools including Big Thompson Elementary School, Walt Clark Middle School, and Thompson Valley High School.
Ownership History
Date
Name
Owned For
Owner Type
Purchase Details
Closed on
Aug 18, 2021
Sold by
Jordin Cynthia and Revocable Living Trust Of Cynt
Bought by
Burton George V and Burton Rebecca M
Current Estimated Value
Purchase Details
Closed on
Jan 22, 2019
Sold by
Jordan Cynthia A
Bought by
The Cynthia Jordan Revocable Living Trus
Purchase Details
Closed on
Jul 15, 2016
Sold by
Ores Nicholas H
Bought by
Jordin Cynthia A
Purchase Details
Closed on
Feb 10, 2012
Sold by
Wilson R Grant and Bonn Robin L
Bought by
Taylor Raymond J
Purchase Details
Closed on
Nov 8, 2008
Sold by
Taylor Raymond J
Bought by
Raymond J Taylor Trust
Purchase Details
Closed on
Aug 28, 2008
Sold by
Taylor Raymond J
Bought by
Taylor Raymond J
Purchase Details
Closed on
Aug 3, 1998
Sold by
Renee Taylor Raymond J Paulette Gabriell
Bought by
Taylor Raymond J and Taylor Paulette Gabrielle Renee
Create a Home Valuation Report for This Property
The Home Valuation Report is an in-depth analysis detailing your home's value as well as a comparison with similar homes in the area
Home Values in the Area
Average Home Value in this Area
Purchase History
| Date | Buyer | Sale Price | Title Company |
|---|---|---|---|
| Burton George V | -- | None Available | |
| The Cynthia Jordan Revocable Living Trus | -- | None Available | |
| Jordin Cynthia A | -- | None Available | |
| Taylor Raymond J | -- | None Available | |
| Raymond J Taylor Trust | -- | None Available | |
| Paulette G Taylor Family Trust | -- | None Available | |
| Taylor Raymond J | -- | None Available | |
| Taylor Raymond J | -- | None Available | |
| Taylor Raymond J | -- | -- |
Source: Public Records
Tax History Compared to Growth
Tax History
| Year | Tax Paid | Tax Assessment Tax Assessment Total Assessment is a certain percentage of the fair market value that is determined by local assessors to be the total taxable value of land and additions on the property. | Land | Improvement |
|---|---|---|---|---|
| 2025 | $3,554 | $47,332 | $3,260 | $44,072 |
| 2024 | $3,430 | $47,332 | $3,260 | $44,072 |
| 2022 | $2,655 | $33,677 | $3,165 | $30,512 |
| 2021 | $2,751 | $34,984 | $3,477 | $31,507 |
| 2020 | $1,796 | $22,830 | $3,329 | $19,501 |
| 2019 | $1,765 | $22,830 | $3,329 | $19,501 |
| 2018 | $1,804 | $22,139 | $3,213 | $18,926 |
| 2017 | $1,552 | $22,139 | $3,213 | $18,926 |
| 2016 | $870 | $18,909 | $3,045 | $15,864 |
| 2015 | $1,298 | $18,910 | $3,050 | $15,860 |
| 2014 | $1,169 | $15,950 | $2,840 | $13,110 |
Source: Public Records
Map
Nearby Homes
- 8150 Open View Place
- 7864 Heart J Trail
- 196 Mule Deer Dr
- 1828 N County Road 29
- 512 Mustang Dr
- 940 S County Road 29
- 712 Colt Dr
- 6811 W County Road 20
- 240 Garnet Valley Ct
- 400 Rugged Rock Rd
- 1350 S County Road 29
- 7831 W Us Highway 34
- 7467 W Us Highway 34
- 1703 N County Road 23h
- 6950 W County Road 18
- 3005 N County Road 29
- 3064 Wildes Rd
- 5794 Jackdaw Dr
- 684 Deer Meadow Dr
- 629 Deer Meadow Dr
- 707 N County Road 29
- 8151 Open View Place
- 8217 Open View Place
- 629 N County Road 29
- 8139 Open View Place
- 755 N County Road 29
- 8216 Open View Place
- 421 N County Road 29
- 7947 Big Valley Dr
- 7948 Big Valley Dr
- 454 N County Road 29
- 408 N County Road 29
- 7918 Heart J Trail
- 330 N County Road 29
- 330 N Carter Lake Rd
- 7876 Big Valley Dr
- 7931 Heart J Trail
- 7943 Heart J Trail
- 264 N County Road 29
- 264 N Carter Lake Rd