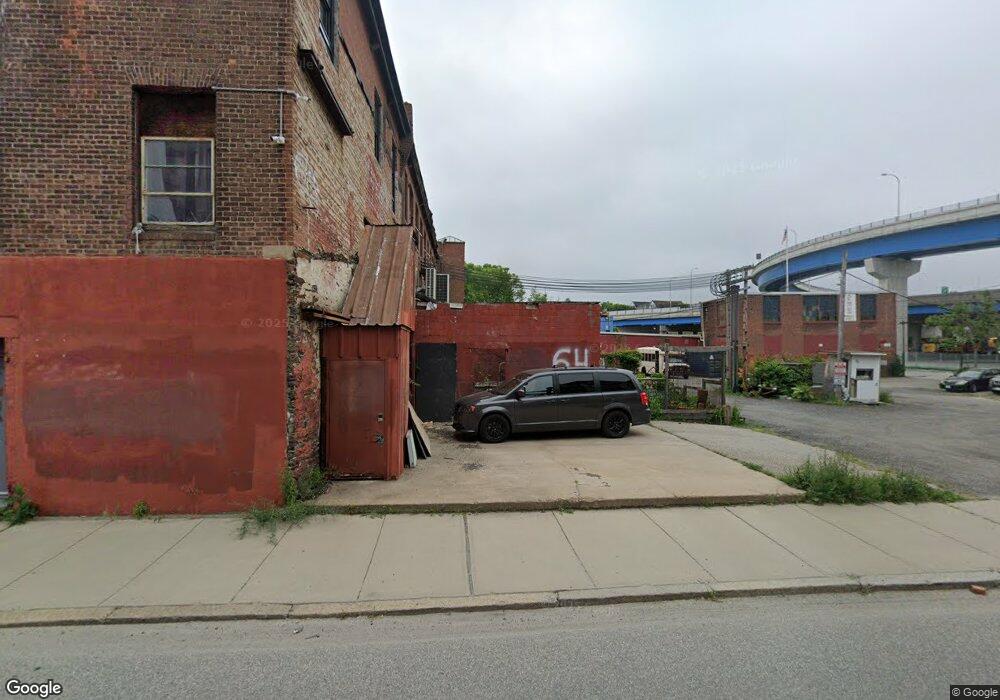
54 Troy St Providence, RI 02909
Olneyville NeighborhoodEstimated Value: $1,185,389
--
Bed
--
Bath
38,245
Sq Ft
$31/Sq Ft
Est. Value
About This Home
This home is located at 54 Troy St, Providence, RI 02909 and is currently estimated at $1,185,389, approximately $30 per square foot. 54 Troy St is a home located in Providence County with nearby schools including Asa Messer Elementary School, Charles N. Fortes Elementary School, and Laurel Hill Annex School.
Ownership History
Date
Name
Owned For
Owner Type
Purchase Details
Closed on
Jun 3, 2011
Sold by
54 Troy Street Bldg Co
Bought by
Bayview Loan Svcg Llc
Current Estimated Value
Purchase Details
Closed on
Jul 25, 2006
Sold by
Zedaka Ltd
Bought by
54 Troy Street Bldg Ll
Home Financials for this Owner
Home Financials are based on the most recent Mortgage that was taken out on this home.
Original Mortgage
$404,000
Interest Rate
6.67%
Mortgage Type
Commercial
Create a Home Valuation Report for This Property
The Home Valuation Report is an in-depth analysis detailing your home's value as well as a comparison with similar homes in the area
Home Values in the Area
Average Home Value in this Area
Purchase History
| Date | Buyer | Sale Price | Title Company |
|---|---|---|---|
| Bayview Loan Svcg Llc | $253,400 | -- | |
| 54 Troy Street Bldg Ll | $685,000 | -- |
Source: Public Records
Mortgage History
| Date | Status | Borrower | Loan Amount |
|---|---|---|---|
| Previous Owner | 54 Troy Street Bldg Ll | $404,000 | |
| Previous Owner | 54 Troy Street Bldg Ll | $130,000 |
Source: Public Records
Tax History Compared to Growth
Tax History
| Year | Tax Paid | Tax Assessment Tax Assessment Total Assessment is a certain percentage of the fair market value that is determined by local assessors to be the total taxable value of land and additions on the property. | Land | Improvement |
|---|---|---|---|---|
| 2025 | $22,688 | $777,000 | $281,600 | $495,400 |
| 2024 | $18,649 | $531,300 | $97,100 | $434,200 |
| 2023 | $18,649 | $531,300 | $97,100 | $434,200 |
| 2022 | $18,808 | $531,300 | $97,100 | $434,200 |
| 2021 | $12,265 | $334,200 | $83,300 | $250,900 |
| 2020 | $12,265 | $334,200 | $83,300 | $250,900 |
| 2019 | $12,265 | $334,200 | $83,300 | $250,900 |
| 2018 | $10,959 | $298,600 | $83,300 | $215,300 |
| 2017 | $10,959 | $298,600 | $83,300 | $215,300 |
| 2016 | $10,959 | $298,600 | $83,300 | $215,300 |
| 2015 | $10,235 | $278,500 | $79,400 | $199,100 |
| 2014 | $16,795 | $457,000 | $79,400 | $377,600 |
| 2013 | $16,795 | $457,000 | $79,400 | $377,600 |
Source: Public Records
Map
Nearby Homes
- 239 Oak St
- 244 Oak St
- 217 Oak St
- 46 Dike St
- 43 Troy St
- 50 Agnes St
- 62 Dike St
- 45 Dike St
- 1828 Westminster St
- 1836 Westminster St
- 1860 Westminster St
- 77 Pilsudski St
- 28 Agnes St
- 1850 Westminster St
- 1820 Westminster St
- 44 Atwood St
- 1910 Westminster St
- 173 Hudson St
- 38 Atwood St Unit 40
- 1938 Westminster St