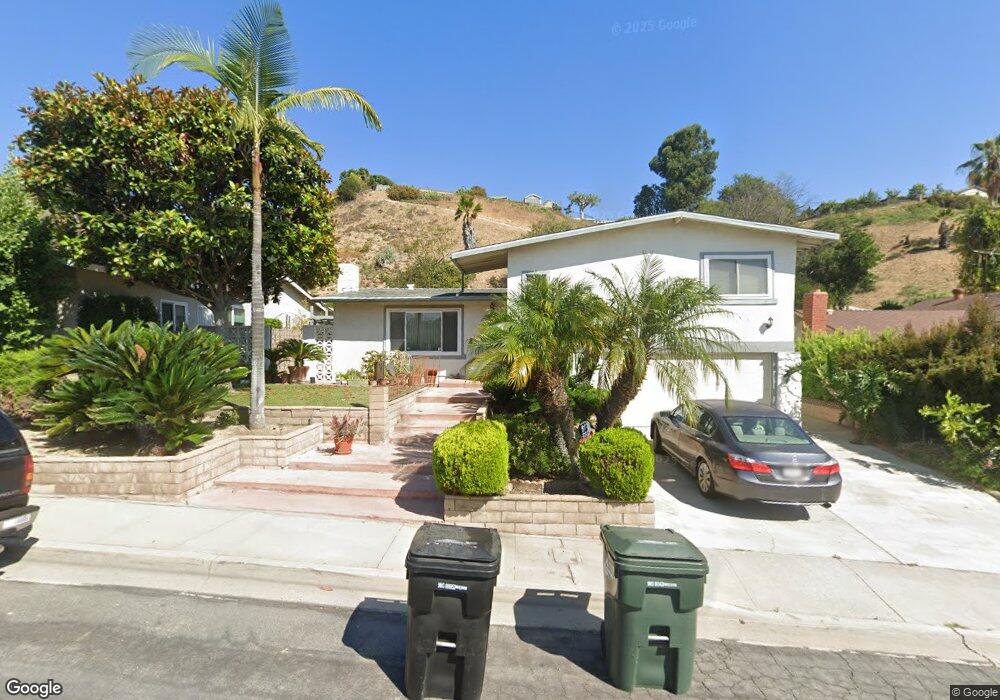
540 Casitas St Monterey Park, CA 91754
Estimated Value: $1,224,000 - $1,407,000
4
Beds
2
Baths
2,265
Sq Ft
$577/Sq Ft
Est. Value
About This Home
This home is located at 540 Casitas St, Monterey Park, CA 91754 and is currently estimated at $1,307,491, approximately $577 per square foot. 540 Casitas St is a home located in Los Angeles County with nearby schools including Monterey Highlands Elementary School, Mark Keppel High School, and KIPP Sol Academy.
Ownership History
Date
Name
Owned For
Owner Type
Purchase Details
Closed on
Feb 5, 2009
Sold by
Chiang Shun Wen
Bought by
Lee Norman Cho Chung
Current Estimated Value
Home Financials for this Owner
Home Financials are based on the most recent Mortgage that was taken out on this home.
Original Mortgage
$345,000
Outstanding Balance
$217,030
Interest Rate
5.01%
Mortgage Type
Purchase Money Mortgage
Estimated Equity
$1,090,462
Purchase Details
Closed on
Feb 23, 2000
Sold by
Rodarte Ruben C and Rodarte Soledad
Bought by
Lee Norman Cho Chung and Chiang Shun Wen
Home Financials for this Owner
Home Financials are based on the most recent Mortgage that was taken out on this home.
Original Mortgage
$238,000
Interest Rate
8.34%
Create a Home Valuation Report for This Property
The Home Valuation Report is an in-depth analysis detailing your home's value as well as a comparison with similar homes in the area
Home Values in the Area
Average Home Value in this Area
Purchase History
| Date | Buyer | Sale Price | Title Company |
|---|---|---|---|
| Lee Norman Cho Chung | $275,500 | Nations Title Company | |
| Lee Norman Cho Chung | $325,000 | First Southwestern Title Co |
Source: Public Records
Mortgage History
| Date | Status | Borrower | Loan Amount |
|---|---|---|---|
| Open | Lee Norman Cho Chung | $345,000 | |
| Previous Owner | Lee Norman Cho Chung | $238,000 |
Source: Public Records
Tax History Compared to Growth
Tax History
| Year | Tax Paid | Tax Assessment Tax Assessment Total Assessment is a certain percentage of the fair market value that is determined by local assessors to be the total taxable value of land and additions on the property. | Land | Improvement |
|---|---|---|---|---|
| 2025 | $9,118 | $693,933 | $377,115 | $316,818 |
| 2024 | $9,118 | $680,327 | $369,721 | $310,606 |
| 2023 | $8,931 | $666,988 | $362,472 | $304,516 |
| 2022 | $8,509 | $653,911 | $355,365 | $298,546 |
| 2021 | $8,401 | $641,091 | $348,398 | $292,693 |
| 2019 | $8,103 | $622,077 | $338,065 | $284,012 |
| 2018 | $8,082 | $609,881 | $331,437 | $278,444 |
| 2016 | $7,462 | $586,201 | $318,568 | $267,633 |
| 2015 | $7,347 | $577,396 | $313,783 | $263,613 |
| 2014 | $7,248 | $566,087 | $307,637 | $258,450 |
Source: Public Records
Map
Nearby Homes
- 486 Elevado Terrace
- 0 S Prospect Dr Unit CV23115343
- 1421 Sombrero Dr
- 1545 Star Ridge Dr
- 220 Barranca Dr
- 1707 Garvey Ave Unit 12
- 1814 Garvey Ave Unit B
- 1001 Abajo Dr
- 1389 Hillside St
- 2656 Whitney Dr
- 2508 El Paseo
- 2560 Las Flores St
- 259 Fremont Ave
- 1581 College View Dr
- 1141 Williams St
- 2029 Tracy Ln
- 1027 De la Fuente St
- 824 De la Fuente St
- 1301 S Atlantic Blvd Unit 234C
- 2058 Vancouver Ave