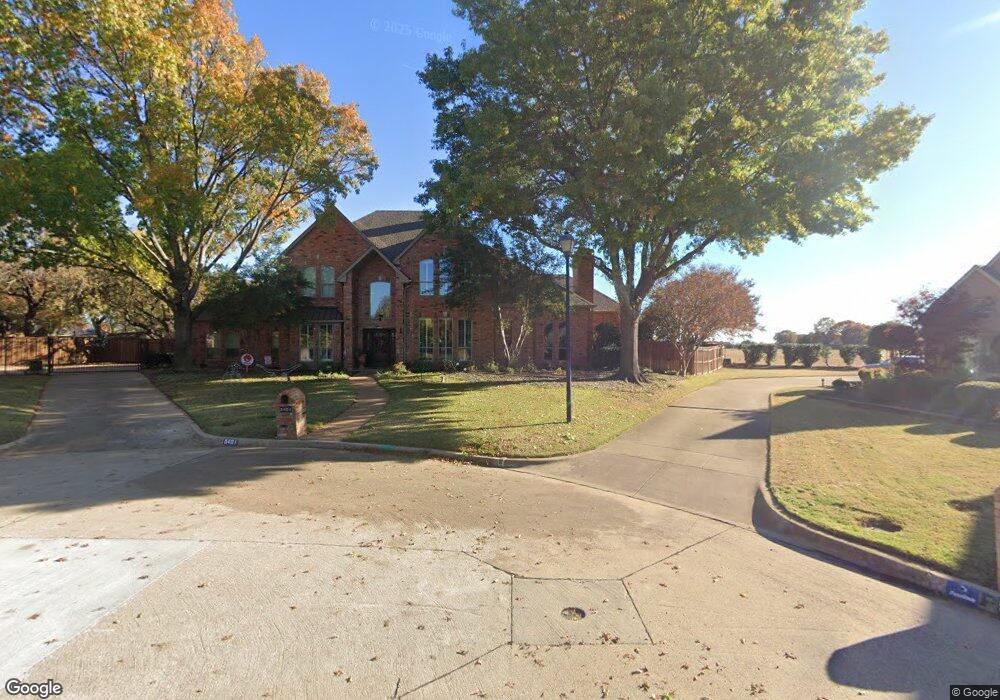
5401 Linden Ct Colleyville, TX 76034
Estimated Value: $943,543 - $1,055,000
5
Beds
3
Baths
3,551
Sq Ft
$275/Sq Ft
Est. Value
About This Home
This home is located at 5401 Linden Ct, Colleyville, TX 76034 and is currently estimated at $976,636, approximately $275 per square foot. 5401 Linden Ct is a home located in Tarrant County with nearby schools including O.C. Taylor Elementary School, Colleyville Middle School, and Waypoint Montessori.
Ownership History
Date
Name
Owned For
Owner Type
Purchase Details
Closed on
Jul 30, 2004
Sold by
Seeker John D and Seeker Patti J
Bought by
Seeker John D and Seeker Patti J
Current Estimated Value
Home Financials for this Owner
Home Financials are based on the most recent Mortgage that was taken out on this home.
Original Mortgage
$209,850
Outstanding Balance
$56,277
Interest Rate
6.18%
Mortgage Type
New Conventional
Estimated Equity
$920,359
Purchase Details
Closed on
Dec 14, 1998
Sold by
Solomon Steven J and Solomon Diane M
Bought by
Seeker John D
Purchase Details
Closed on
Apr 18, 1994
Sold by
Miller Rickie L and Miller Mary F
Bought by
Solomon Steven J and Solomon Diane M
Home Financials for this Owner
Home Financials are based on the most recent Mortgage that was taken out on this home.
Original Mortgage
$220,000
Interest Rate
7.71%
Create a Home Valuation Report for This Property
The Home Valuation Report is an in-depth analysis detailing your home's value as well as a comparison with similar homes in the area
Home Values in the Area
Average Home Value in this Area
Purchase History
| Date | Buyer | Sale Price | Title Company |
|---|---|---|---|
| Seeker John D | -- | First American Title | |
| Seeker John D | -- | Rattikin Title Company | |
| Solomon Steven J | -- | Commonwealth Land Title |
Source: Public Records
Mortgage History
| Date | Status | Borrower | Loan Amount |
|---|---|---|---|
| Open | Seeker John D | $209,850 | |
| Previous Owner | Solomon Steven J | $220,000 |
Source: Public Records
Tax History Compared to Growth
Tax History
| Year | Tax Paid | Tax Assessment Tax Assessment Total Assessment is a certain percentage of the fair market value that is determined by local assessors to be the total taxable value of land and additions on the property. | Land | Improvement |
|---|---|---|---|---|
| 2025 | $2,423 | $819,740 | $237,200 | $582,540 |
| 2024 | $2,423 | $819,740 | $237,200 | $582,540 |
| 2023 | $10,410 | $894,281 | $237,200 | $657,081 |
| 2022 | $11,080 | $740,158 | $237,200 | $502,958 |
| 2021 | $11,200 | $510,001 | $142,320 | $367,681 |
| 2020 | $11,333 | $510,001 | $142,320 | $367,681 |
| 2019 | $11,791 | $510,000 | $142,320 | $367,680 |
| 2018 | $2,993 | $503,405 | $95,000 | $408,405 |
| 2017 | $10,961 | $463,973 | $95,000 | $368,973 |
| 2016 | $10,546 | $460,091 | $95,000 | $365,091 |
| 2015 | $9,206 | $405,800 | $50,000 | $355,800 |
| 2014 | $9,206 | $405,800 | $50,000 | $355,800 |
Source: Public Records
Map
Nearby Homes
- 5504 Sycamore Dr
- 2906 Cottonwood Ln
- 2906 Edgewood Ln
- 4214 Hearthside Dr
- 4213 Hearthside Dr
- 5404 Miramar Ln
- 4282 Hearthside Dr
- 3216 Glade Rd
- 3329 Moss Creek Dr
- 3321 Circlewood Ct
- 5613 Versailles Ct
- 4723 Bill Simmons Rd
- 1808 Arthur Dr
- 4816 Bill Simmons Rd
- 3278 Birch Ave
- 4612 Bill Simmons Rd
- 5508 Coventry Ct
- 1916 Renfro Rd
- 3904 Wagon Wheel Dr
- 4309 Meandering Way
- 5402 Juniper Ct
- 5403 Linden Ct
- 5400 Linden Ct
- 5400 Juniper Ct
- 5402 Linden Ct
- 5404 Juniper Ct
- 2409 Arbor Trail
- 2501 Arbor Trail
- 5401 Juniper Ct
- 5404 Linden Ct
- 5309 Braedon Ln
- 5406 Juniper Ct
- 5403 Juniper Ct
- 5301 Braedon Ln
- 2405 Arbor Trail
- 5402 Birch Ct
- 5405 Juniper Ct
- 2408 Hawthorne Ave
- 2406 Arbor Trail
- 5404 Birch Ct