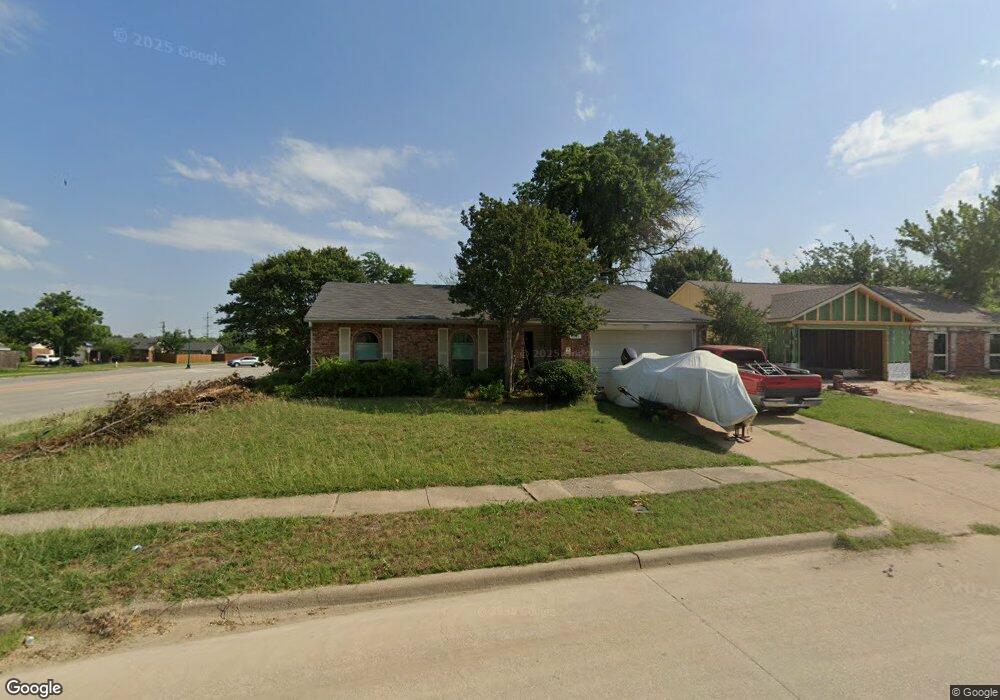
5401 Ramsey Dr the Colony, TX 75056
Estimated Value: $302,000 - $336,000
3
Beds
2
Baths
1,379
Sq Ft
$233/Sq Ft
Est. Value
About This Home
This home is located at 5401 Ramsey Dr, the Colony, TX 75056 and is currently estimated at $321,494, approximately $233 per square foot. 5401 Ramsey Dr is a home located in Denton County with nearby schools including Peters Colony Elementary School, Griffin Middle School, and The Colony High School.
Ownership History
Date
Name
Owned For
Owner Type
Purchase Details
Closed on
May 31, 2016
Sold by
Mcmillan Brett L and Mcmillan Jill
Bought by
Eberhart Marcella K
Current Estimated Value
Home Financials for this Owner
Home Financials are based on the most recent Mortgage that was taken out on this home.
Original Mortgage
$155,138
Outstanding Balance
$123,633
Interest Rate
3.61%
Mortgage Type
FHA
Estimated Equity
$197,861
Purchase Details
Closed on
Mar 11, 2014
Sold by
Green Kelli
Bought by
Mcmillan Brett L and Mcmillan Jill
Home Financials for this Owner
Home Financials are based on the most recent Mortgage that was taken out on this home.
Original Mortgage
$109,600
Interest Rate
4.36%
Mortgage Type
New Conventional
Purchase Details
Closed on
Jan 14, 2014
Sold by
Salazar Janice Carol
Bought by
Green Kelli
Home Financials for this Owner
Home Financials are based on the most recent Mortgage that was taken out on this home.
Original Mortgage
$109,600
Interest Rate
4.36%
Mortgage Type
New Conventional
Create a Home Valuation Report for This Property
The Home Valuation Report is an in-depth analysis detailing your home's value as well as a comparison with similar homes in the area
Home Values in the Area
Average Home Value in this Area
Purchase History
| Date | Buyer | Sale Price | Title Company |
|---|---|---|---|
| Eberhart Marcella K | -- | Rtt | |
| Mcmillan Brett L | -- | Rtt | |
| Green Kelli | -- | Rtt |
Source: Public Records
Mortgage History
| Date | Status | Borrower | Loan Amount |
|---|---|---|---|
| Open | Eberhart Marcella K | $155,138 | |
| Previous Owner | Mcmillan Brett L | $109,600 |
Source: Public Records
Tax History Compared to Growth
Tax History
| Year | Tax Paid | Tax Assessment Tax Assessment Total Assessment is a certain percentage of the fair market value that is determined by local assessors to be the total taxable value of land and additions on the property. | Land | Improvement |
|---|---|---|---|---|
| 2025 | $4,237 | $307,898 | $71,150 | $289,961 |
| 2024 | $5,432 | $279,907 | $0 | $0 |
| 2023 | $3,815 | $254,461 | $71,150 | $277,408 |
| 2022 | $4,856 | $231,328 | $71,150 | $236,186 |
| 2021 | $4,684 | $244,700 | $44,042 | $200,658 |
| 2020 | $4,250 | $191,180 | $44,042 | $185,252 |
| 2019 | $3,990 | $173,800 | $44,042 | $141,958 |
| 2018 | $3,650 | $158,000 | $44,042 | $113,958 |
| 2017 | $3,691 | $158,000 | $44,042 | $113,958 |
| 2016 | $4,195 | $179,567 | $25,690 | $153,877 |
| 2015 | $2,440 | $152,435 | $25,690 | $126,745 |
| 2013 | -- | $99,931 | $25,690 | $74,241 |
Source: Public Records
Map
Nearby Homes