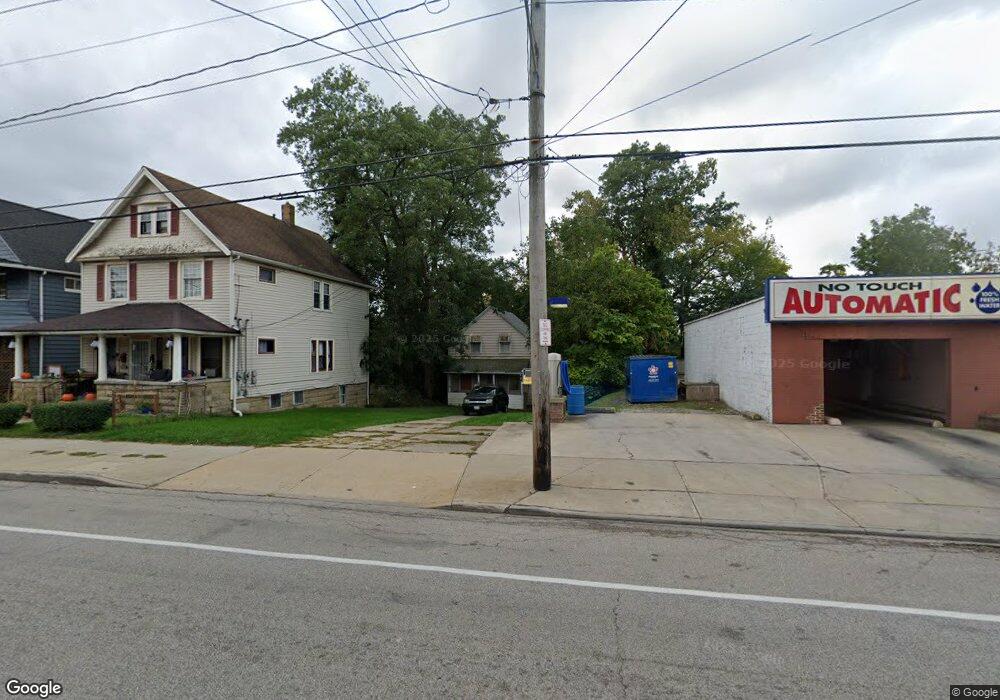
5405 Denison Ave Cleveland, OH 44102
Stockyards NeighborhoodEstimated Value: $82,000 - $97,000
4
Beds
2
Baths
1,117
Sq Ft
$81/Sq Ft
Est. Value
About This Home
This home is located at 5405 Denison Ave, Cleveland, OH 44102 and is currently estimated at $90,782, approximately $81 per square foot. 5405 Denison Ave is a home located in Cuyahoga County with nearby schools including Almira Academy, Benjamin Franklin, and Artemus Ward School.
Ownership History
Date
Name
Owned For
Owner Type
Purchase Details
Closed on
Apr 23, 2001
Sold by
Koval Vladimir and Martinichin Vladimir
Bought by
Rivera Isabel
Current Estimated Value
Purchase Details
Closed on
Sep 26, 2000
Sold by
Danly Investments Inc
Bought by
Koval Vladimir and Martinichin Vladimir
Purchase Details
Closed on
Mar 27, 2000
Sold by
Imc Mtg Company
Bought by
Danly Investments Inc
Purchase Details
Closed on
Dec 21, 1999
Sold by
Justine Parker
Bought by
Imc Mtg Company
Purchase Details
Closed on
Dec 23, 1997
Sold by
Jedlicka Arnold V
Bought by
Parker Justine
Home Financials for this Owner
Home Financials are based on the most recent Mortgage that was taken out on this home.
Original Mortgage
$40,800
Interest Rate
11.15%
Purchase Details
Closed on
Mar 28, 1985
Sold by
Hoke Rondal Lee
Bought by
Hoke Rondal L
Purchase Details
Closed on
May 25, 1978
Sold by
Klarriech Harold L
Bought by
Hoke Rondal Lee
Purchase Details
Closed on
Jan 1, 1975
Bought by
Klarriech Harold L
Create a Home Valuation Report for This Property
The Home Valuation Report is an in-depth analysis detailing your home's value as well as a comparison with similar homes in the area
Home Values in the Area
Average Home Value in this Area
Purchase History
| Date | Buyer | Sale Price | Title Company |
|---|---|---|---|
| Rivera Isabel | $51,000 | -- | |
| Koval Vladimir | $31,000 | -- | |
| Danly Investments Inc | $15,500 | -- | |
| Imc Mtg Company | $20,000 | -- | |
| Parker Justine | $51,000 | Heights Title Agency Inc | |
| Hoke Rondal L | -- | -- | |
| Hoke Rondal Lee | $10,500 | -- | |
| Klarriech Harold L | -- | -- |
Source: Public Records
Mortgage History
| Date | Status | Borrower | Loan Amount |
|---|---|---|---|
| Previous Owner | Parker Justine | $40,800 | |
| Closed | Parker Justine | $5,100 |
Source: Public Records
Tax History Compared to Growth
Tax History
| Year | Tax Paid | Tax Assessment Tax Assessment Total Assessment is a certain percentage of the fair market value that is determined by local assessors to be the total taxable value of land and additions on the property. | Land | Improvement |
|---|---|---|---|---|
| 2024 | $544 | $8,295 | $4,830 | $3,465 |
| 2023 | $569 | $7,500 | $3,050 | $4,450 |
| 2022 | $566 | $7,490 | $3,050 | $4,450 |
| 2021 | $560 | $7,490 | $3,050 | $4,450 |
| 2020 | $499 | $5,780 | $2,350 | $3,430 |
| 2019 | $462 | $16,500 | $6,700 | $9,800 |
| 2018 | $561 | $5,780 | $2,350 | $3,430 |
| 2017 | $667 | $8,090 | $1,440 | $6,650 |
| 2016 | $662 | $8,090 | $1,440 | $6,650 |
| 2015 | $739 | $8,090 | $1,440 | $6,650 |
| 2014 | $739 | $9,000 | $1,610 | $7,390 |
Source: Public Records
Map
Nearby Homes
- 3625 W 50th St
- 3514 W 58th St
- 3492 W 56th St
- 3644 W 48th St
- 3500 W 62nd St
- 3477 W 63rd St
- 3594 W 47th St
- 3482 W 49th St
- 3640 W 47th Place
- 3579 W 47th St
- 3412 W 63rd St
- 3567 W 46th St
- 3426 W 65th St
- 3420 W 49th St
- 3431 W 49th St
- 3608 W 45th St
- 6412 Storer Ave
- 3336 W 54th St
- 4420 Bush Ave
- 5628 Pacific Ave
- 5401 Denison Ave
- 5323 Denison Ave
- 5315 Denison Ave
- 5406 Denison Ave
- 5400 Denison Ave
- 5400 Denison Ave Unit Dwn Front
- 5311 Denison Ave
- 5515 Denison Ave
- 5500 Denison Ave
- 5601 Denison Ave
- 5510 Denison Ave
- 3580 W 54th St
- 3572 W 54th St
- 3561 W 56th St
- 3570 W 54th St
- 3557 W 56th St
- 3566 W 54th St
- 3560 W 56th St
- 3553 W 56th St
- 3562 W 54th St