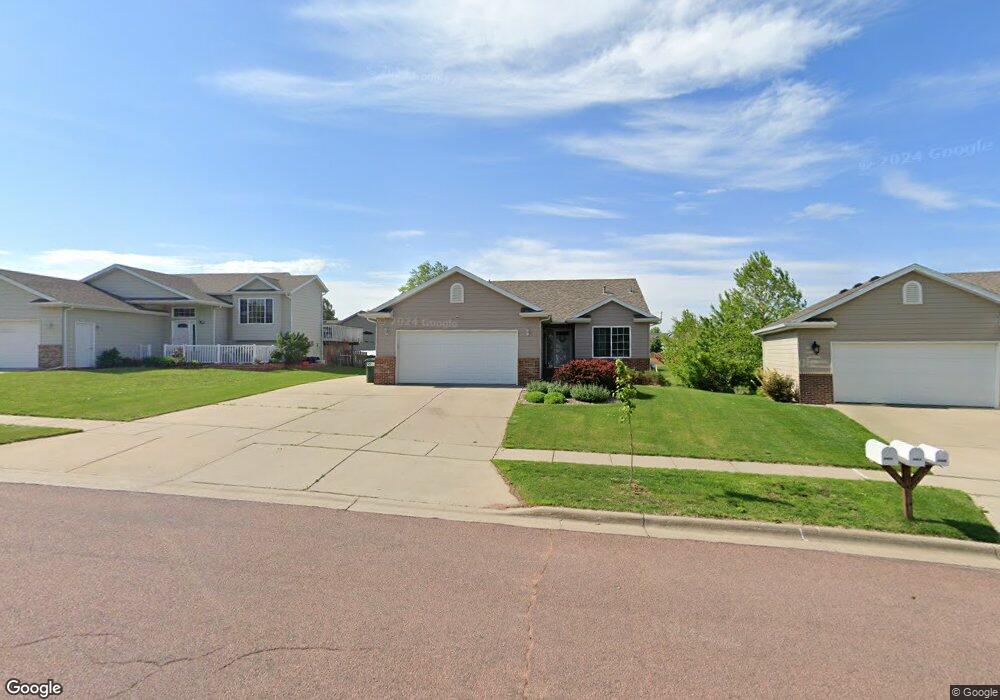
5405 W Pineridge Dr Sioux Falls, SD 57107
Northwest Sioux Falls NeighborhoodEstimated Value: $341,000 - $373,000
3
Beds
2
Baths
1,815
Sq Ft
$195/Sq Ft
Est. Value
About This Home
This home is located at 5405 W Pineridge Dr, Sioux Falls, SD 57107 and is currently estimated at $354,084, approximately $195 per square foot. 5405 W Pineridge Dr is a home located in Minnehaha County with nearby schools including Renberg Elementary School, George McGovern Middle School, and Jefferson High School - 67.
Ownership History
Date
Name
Owned For
Owner Type
Purchase Details
Closed on
May 5, 2020
Sold by
Hanson Paul J and Hanson Sara M
Bought by
Dilts Derek and Dilts Victoria
Current Estimated Value
Home Financials for this Owner
Home Financials are based on the most recent Mortgage that was taken out on this home.
Original Mortgage
$232,750
Outstanding Balance
$206,249
Interest Rate
3.3%
Mortgage Type
New Conventional
Estimated Equity
$147,835
Purchase Details
Closed on
Apr 14, 2017
Sold by
Wolfe Matthew and Wolfe Sadie
Bought by
Hanson Paul J and Hanson Sara M
Purchase Details
Closed on
Nov 20, 2014
Sold by
Brad Brad and Larson Carlie
Bought by
Wolfe Matthew and Wolfe Sadie
Home Financials for this Owner
Home Financials are based on the most recent Mortgage that was taken out on this home.
Original Mortgage
$143,600
Interest Rate
4.1%
Mortgage Type
New Conventional
Purchase Details
Closed on
Aug 21, 2012
Sold by
Larry W Larry W and Heer Evelea J
Bought by
Larson Brad and Larson Carlie
Create a Home Valuation Report for This Property
The Home Valuation Report is an in-depth analysis detailing your home's value as well as a comparison with similar homes in the area
Home Values in the Area
Average Home Value in this Area
Purchase History
| Date | Buyer | Sale Price | Title Company |
|---|---|---|---|
| Dilts Derek | $245,000 | Stewart Title Company | |
| Hanson Paul J | $210,000 | -- | |
| Wolfe Matthew | $179,500 | Dataquick Title Llc | |
| Larson Brad | $170,000 | -- |
Source: Public Records
Mortgage History
| Date | Status | Borrower | Loan Amount |
|---|---|---|---|
| Open | Dilts Derek | $232,750 | |
| Previous Owner | Wolfe Matthew | $143,600 |
Source: Public Records
Tax History Compared to Growth
Tax History
| Year | Tax Paid | Tax Assessment Tax Assessment Total Assessment is a certain percentage of the fair market value that is determined by local assessors to be the total taxable value of land and additions on the property. | Land | Improvement |
|---|---|---|---|---|
| 2024 | $4,503 | $332,800 | $33,000 | $299,800 |
| 2023 | $4,391 | $312,400 | $33,000 | $279,400 |
| 2022 | $3,937 | $263,500 | $33,000 | $230,500 |
| 2021 | $3,217 | $228,500 | $0 | $0 |
| 2020 | $3,217 | $205,600 | $0 | $0 |
| 2019 | $3,098 | $194,374 | $0 | $0 |
| 2018 | $2,731 | $186,252 | $0 | $0 |
| 2017 | $2,687 | $171,641 | $30,588 | $141,053 |
| 2016 | $2,687 | $169,076 | $30,588 | $138,488 |
| 2015 | $2,687 | $162,664 | $30,587 | $132,077 |
| 2014 | $2,534 | $156,484 | $30,436 | $126,048 |
Source: Public Records
Map
Nearby Homes
- 1405 N Conifer Place Unit 6
- 1413 N Holbrook Ave Ave
- 1313 N Hazel Place Unit 15
- 1419 N Conifer Place Unit 18
- 1323 N Fir Place Unit 24
- 5601 W Oakcrest Dr
- 1432 N Conifer Place Unit 32
- 5315 W Boxwood Place Unit 60
- 5302 W Sourwood Place
- 5300 W Sourwood Place
- 1263 N Marion Rd Unit 1
- 1263 N Marion Rd Unit 3
- 1263 N Marion Rd Unit 4
- 1263 N Marion Rd Unit 2
- 1263 N Marion Rd Unit 5
- 1249 N Marion Rd Unit 3
- 1249 N Marion Rd Unit 4
- 1249 N Marion Rd Unit 5
- 1249 N Marion Rd Unit 2
- 1271 N Marion Rd Unit 2
- 5405 W Pineridge Dr Dr
- 5401 W Pineridge Dr
- 5409 W Pineridge Dr
- 1315 N Holbrook Ave
- 5501 W Pineridge Dr
- 5404 W Pineridge Dr
- 5400 W Pineridge Dr
- 5505 W Pineridge Dr
- 5504 W Pineridge Dr
- 5601 W Pineridge Dr
- 5504 W Oakcrest Dr
- 5508 W Oakcrest Dr
- 1405 N Holbrook Ave
- 5512 W Oakcrest Dr
- 5500 W Oakcrest Dr
- 5600 W Pineridge Dr
- 1403 N Conifer Place Unit 4
- 5516 W Oakcrest Dr
- 1401 N Conifer Place Unit 2
- 5605 W Pineridge Dr