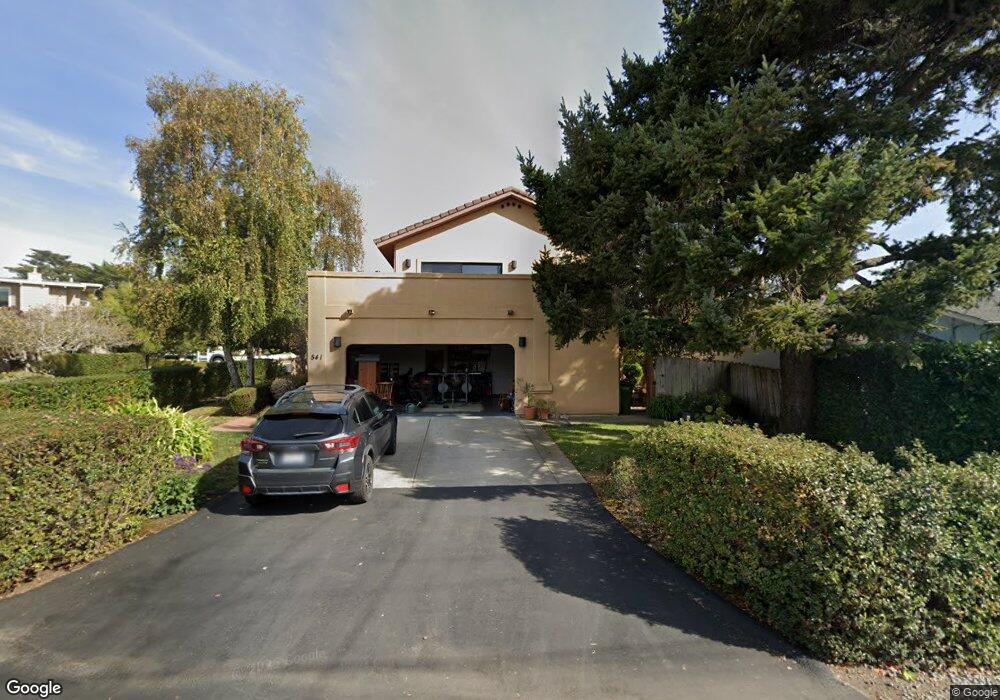
541 Bayview Dr Aptos, CA 95003
Rio del Mar NeighborhoodEstimated Value: $1,689,000 - $3,208,000
4
Beds
3
Baths
2,040
Sq Ft
$1,106/Sq Ft
Est. Value
About This Home
This home is located at 541 Bayview Dr, Aptos, CA 95003 and is currently estimated at $2,257,253, approximately $1,106 per square foot. 541 Bayview Dr is a home located in Santa Cruz County with nearby schools including Rio Del Mar Elementary School, Aptos Junior High School, and Aptos High School.
Ownership History
Date
Name
Owned For
Owner Type
Purchase Details
Closed on
Feb 6, 2015
Sold by
Farmer Sandra L
Bought by
Sandra L Farmer 2015 Trust
Current Estimated Value
Purchase Details
Closed on
Aug 6, 1996
Sold by
Greene Paul James and Greene Anita Joan
Bought by
Farmer Sandra L
Home Financials for this Owner
Home Financials are based on the most recent Mortgage that was taken out on this home.
Original Mortgage
$271,000
Interest Rate
8.33%
Purchase Details
Closed on
Jun 2, 1995
Sold by
Robinson Richard and Robinson Barbara
Bought by
Counts David Michael and Counts Tina Louise
Create a Home Valuation Report for This Property
The Home Valuation Report is an in-depth analysis detailing your home's value as well as a comparison with similar homes in the area
Home Values in the Area
Average Home Value in this Area
Purchase History
| Date | Buyer | Sale Price | Title Company |
|---|---|---|---|
| Sandra L Farmer 2015 Trust | -- | None Available | |
| Farmer Sandra L | $410,500 | Old Republic Title Company | |
| Counts David Michael | $175,000 | North American Title Company |
Source: Public Records
Mortgage History
| Date | Status | Borrower | Loan Amount |
|---|---|---|---|
| Closed | Farmer Sandra L | $271,000 |
Source: Public Records
Tax History Compared to Growth
Tax History
| Year | Tax Paid | Tax Assessment Tax Assessment Total Assessment is a certain percentage of the fair market value that is determined by local assessors to be the total taxable value of land and additions on the property. | Land | Improvement |
|---|---|---|---|---|
| 2025 | $8,481 | $668,550 | $374,605 | $293,945 |
| 2023 | $8,289 | $642,590 | $360,059 | $282,531 |
| 2022 | $8,098 | $629,990 | $352,999 | $276,991 |
| 2021 | $7,822 | $617,637 | $346,077 | $271,560 |
| 2020 | $7,687 | $611,304 | $342,529 | $268,775 |
| 2019 | $7,549 | $599,318 | $335,813 | $263,505 |
| 2018 | $7,342 | $587,566 | $329,228 | $258,338 |
| 2017 | $7,272 | $576,046 | $322,773 | $253,273 |
| 2016 | $7,094 | $564,751 | $316,444 | $248,307 |
| 2015 | $7,014 | $556,268 | $311,691 | $244,577 |
| 2014 | $6,847 | $545,371 | $305,585 | $239,786 |
Source: Public Records
Map
Nearby Homes