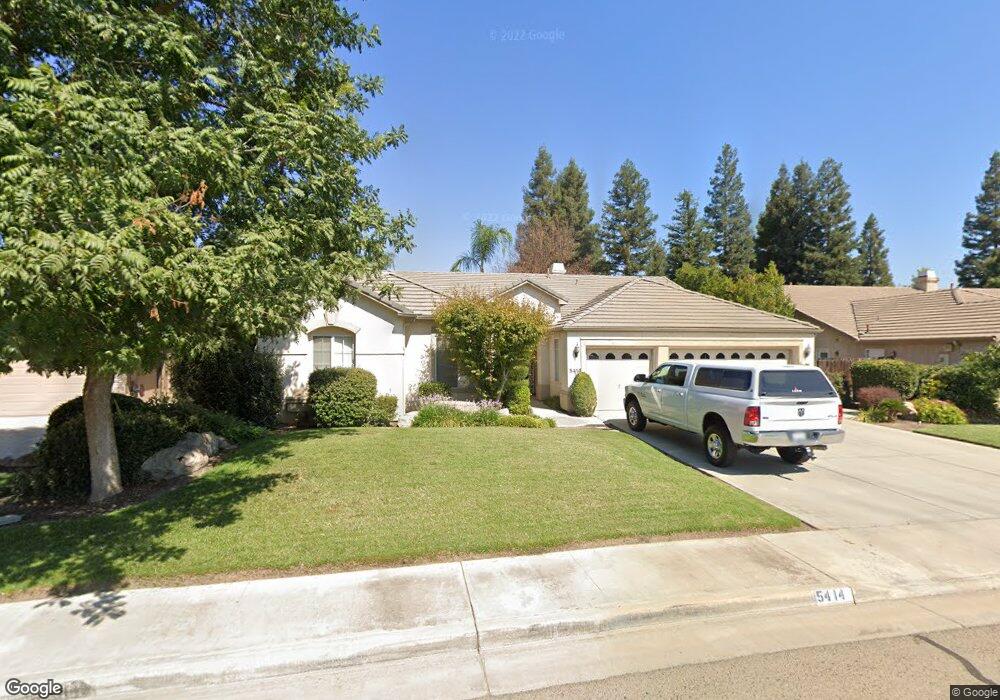
5414 W Vine Ct Visalia, CA 93291
Northwest Visalia NeighborhoodEstimated Value: $657,538 - $682,000
4
Beds
2
Baths
2,496
Sq Ft
$268/Sq Ft
Est. Value
About This Home
This home is located at 5414 W Vine Ct, Visalia, CA 93291 and is currently estimated at $668,635, approximately $267 per square foot. 5414 W Vine Ct is a home located in Tulare County with nearby schools including Hurley Elementary School, Ridgeview Middle, and Redwood High School.
Ownership History
Date
Name
Owned For
Owner Type
Purchase Details
Closed on
Jun 11, 2024
Sold by
Daily Duane and Daily Jennifer R
Bought by
Duane Daily And Jennifer R Daily Family Trust and Daily
Current Estimated Value
Purchase Details
Closed on
Jul 20, 2010
Sold by
Grove Jody G
Bought by
Daily Duane and Daily Jennifer
Home Financials for this Owner
Home Financials are based on the most recent Mortgage that was taken out on this home.
Original Mortgage
$300,000
Interest Rate
4.65%
Mortgage Type
New Conventional
Purchase Details
Closed on
Oct 9, 2008
Sold by
Grove Jody
Bought by
Grove Jody G and Grove Kari D
Purchase Details
Closed on
Sep 1, 1998
Sold by
Centex International Inc
Bought by
Grove Jody and Grove Kari
Home Financials for this Owner
Home Financials are based on the most recent Mortgage that was taken out on this home.
Original Mortgage
$209,000
Interest Rate
6.88%
Create a Home Valuation Report for This Property
The Home Valuation Report is an in-depth analysis detailing your home's value as well as a comparison with similar homes in the area
Home Values in the Area
Average Home Value in this Area
Purchase History
| Date | Buyer | Sale Price | Title Company |
|---|---|---|---|
| Duane Daily And Jennifer R Daily Family Trust | -- | None Listed On Document | |
| Daily Duane | -- | None Listed On Document | |
| Daily Duane | $375,000 | Chicago Title Company | |
| Grove Jody G | -- | None Available | |
| Grove Jody | $232,500 | Chicago Title Co |
Source: Public Records
Mortgage History
| Date | Status | Borrower | Loan Amount |
|---|---|---|---|
| Previous Owner | Daily Duane | $300,000 | |
| Previous Owner | Grove Jody | $209,000 |
Source: Public Records
Tax History Compared to Growth
Tax History
| Year | Tax Paid | Tax Assessment Tax Assessment Total Assessment is a certain percentage of the fair market value that is determined by local assessors to be the total taxable value of land and additions on the property. | Land | Improvement |
|---|---|---|---|---|
| 2025 | $5,173 | $480,441 | $89,682 | $390,759 |
| 2024 | $5,173 | $471,022 | $87,924 | $383,098 |
| 2023 | $5,017 | $461,787 | $86,200 | $375,587 |
| 2022 | $4,851 | $452,733 | $84,510 | $368,223 |
| 2021 | $4,774 | $443,856 | $82,853 | $361,003 |
| 2020 | $4,749 | $439,304 | $82,003 | $357,301 |
| 2019 | $4,600 | $430,690 | $80,395 | $350,295 |
| 2018 | $4,489 | $422,245 | $78,819 | $343,426 |
| 2017 | $4,414 | $413,966 | $77,274 | $336,692 |
| 2016 | $4,348 | $405,849 | $75,759 | $330,090 |
| 2015 | $4,225 | $399,753 | $74,621 | $325,132 |
| 2014 | $4,225 | $391,922 | $73,159 | $318,763 |
Source: Public Records
Map
Nearby Homes
- 5525 W Perez Ave
- 5614 W Prospect Dr
- 5515 W Sunnyview Ave
- 5701 W Buena Vista Ave
- 5721 W Prospect Dr
- 1536 N Tamarack St
- 1617 N Aspen Ct
- 4926 W Buena Vista Ave
- 5235 W Pianosa Ct
- 2144 N Tommy St
- 5503 W Sweet Dr
- 6310 W Harold Ave
- 1615 N Volterra Ct
- Carrera Plan at Sycamore Ranch
- Aspen with Loft Plan at Sycamore Ranch
- Naples Plan at Sycamore Ranch
- Marsala Plan at Sycamore Ranch
- Verona with Loft Plan at Sycamore Ranch
- Sydney Plan at Sycamore Ranch
- Aspen Plan at Sycamore Ranch
- 5428 W Vine Ct
- 5402 W Vine Ct
- 5425 W Perez Ave
- 5190 W Vine Ct
- 5411 W Perez Ave
- 5437 W Perez Ave
- 5438 W Vine Ct
- 5415 W Vine Ct
- 5401 W Vine Ct
- 5447 W Perez Ave
- 5429 W Vine Ct
- 5444 W Vine Ct
- 2042 N Maselli St
- 2030 N Maselli St
- 5509 W Perez Ave
- 5441 W Vine Ct
- 2046 N Maselli St
- 2016 N Maselli St
- 2050 N Maselli St Unit 1
- 2050 N Maselli St