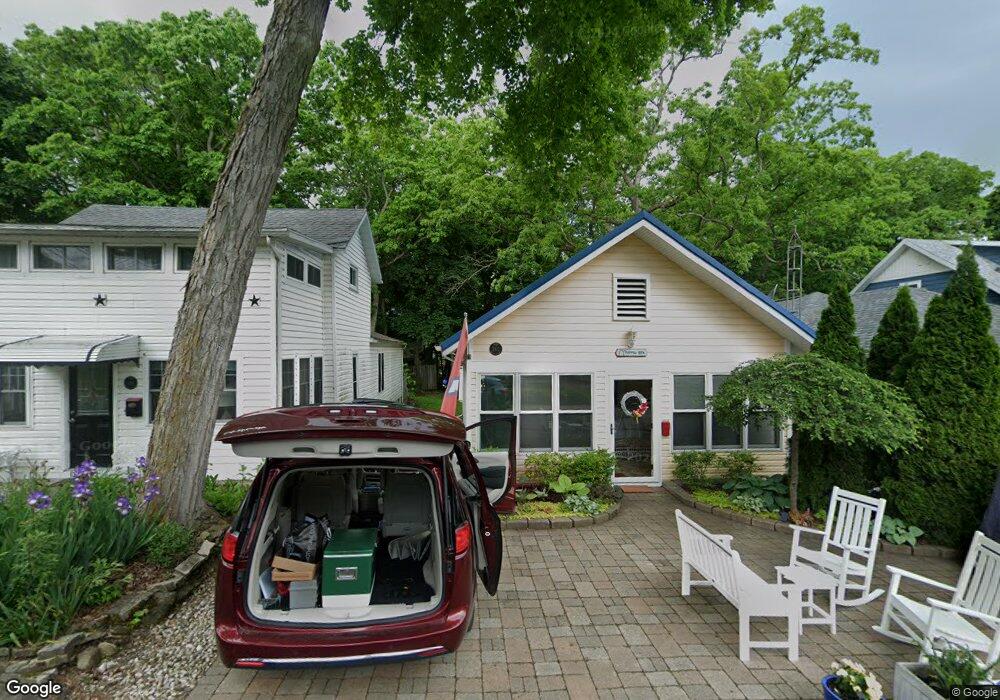
542 Cedar Ave Lakeside Marblehead, OH 43440
Estimated Value: $220,000 - $485,000
2
Beds
1
Bath
810
Sq Ft
$483/Sq Ft
Est. Value
About This Home
This home is located at 542 Cedar Ave, Lakeside Marblehead, OH 43440 and is currently estimated at $391,506, approximately $483 per square foot. 542 Cedar Ave is a home located in Ottawa County with nearby schools including Danbury Middle School and Danbury High School.
Ownership History
Date
Name
Owned For
Owner Type
Purchase Details
Closed on
Dec 12, 2024
Sold by
Melville Peter K and Melville Mary Beth
Bought by
Melville Joint Revocable Living Trust and Melville
Current Estimated Value
Purchase Details
Closed on
Aug 20, 2010
Sold by
Edgar Daniel D and Edgar Judith A
Bought by
Melville Peter K and Melville Mary Beth
Purchase Details
Closed on
Sep 8, 1997
Sold by
Vanscyoc Esther M
Bought by
Edgar Daniel D and Edgar Judith A
Create a Home Valuation Report for This Property
The Home Valuation Report is an in-depth analysis detailing your home's value as well as a comparison with similar homes in the area
Home Values in the Area
Average Home Value in this Area
Purchase History
| Date | Buyer | Sale Price | Title Company |
|---|---|---|---|
| Melville Joint Revocable Living Trust | -- | None Listed On Document | |
| Melville Joint Revocable Living Trust | -- | None Listed On Document | |
| Melville Peter K | $224,000 | Attorney | |
| Edgar Daniel D | $115,000 | -- |
Source: Public Records
Tax History Compared to Growth
Tax History
| Year | Tax Paid | Tax Assessment Tax Assessment Total Assessment is a certain percentage of the fair market value that is determined by local assessors to be the total taxable value of land and additions on the property. | Land | Improvement |
|---|---|---|---|---|
| 2024 | $3,542 | $103,912 | $48,132 | $55,780 |
| 2023 | $3,542 | $87,423 | $37,023 | $50,400 |
| 2022 | $3,018 | $87,423 | $37,023 | $50,400 |
| 2021 | $3,027 | $87,420 | $37,020 | $50,400 |
| 2020 | $2,754 | $75,280 | $36,300 | $38,980 |
| 2019 | $2,549 | $75,280 | $36,300 | $38,980 |
| 2018 | $2,546 | $75,280 | $36,300 | $38,980 |
| 2017 | $2,110 | $61,760 | $26,890 | $34,870 |
| 2016 | $2,088 | $61,760 | $26,890 | $34,870 |
| 2015 | $2,096 | $61,760 | $26,890 | $34,870 |
| 2014 | $1,362 | $78,400 | $42,240 | $36,160 |
| 2013 | $2,527 | $78,400 | $42,240 | $36,160 |
Source: Public Records
Map
Nearby Homes