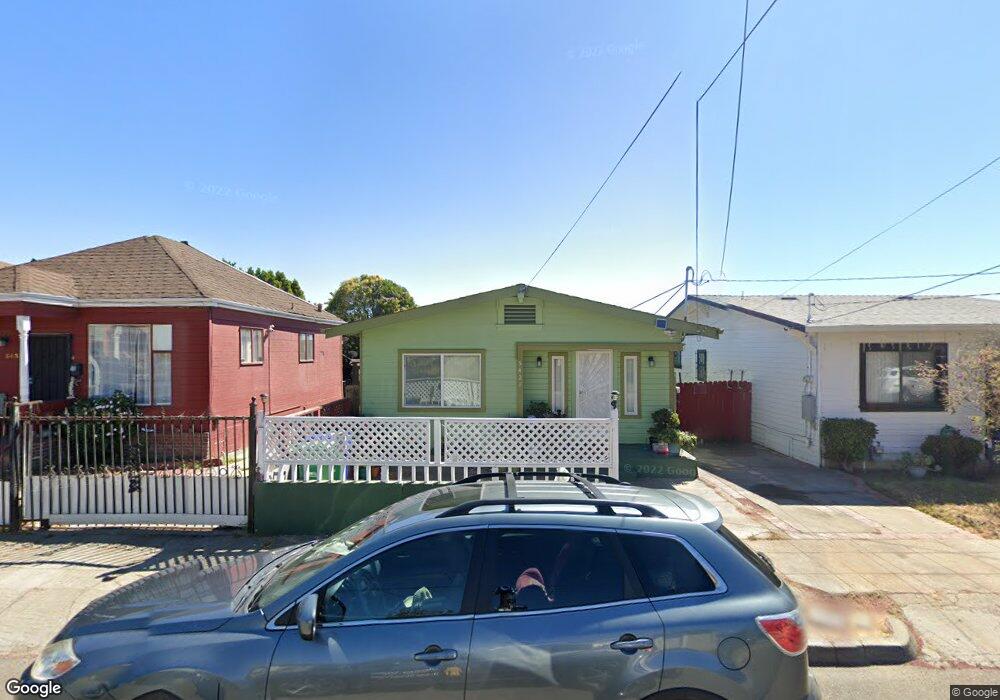
5421 Crittenden St Oakland, CA 94601
Wentworth Holland NeighborhoodEstimated Value: $404,000 - $522,000
2
Beds
1
Bath
912
Sq Ft
$502/Sq Ft
Est. Value
About This Home
This home is located at 5421 Crittenden St, Oakland, CA 94601 and is currently estimated at $457,421, approximately $501 per square foot. 5421 Crittenden St is a home located in Alameda County with nearby schools including Bridges Academy Elementary School, Greenleaf TK-8, and Coliseum College Prep Academy.
Ownership History
Date
Name
Owned For
Owner Type
Purchase Details
Closed on
Oct 3, 2017
Sold by
Nguyen Quynhy Thuy and Pham Phong Ha
Bought by
Pham Phong Ha
Current Estimated Value
Home Financials for this Owner
Home Financials are based on the most recent Mortgage that was taken out on this home.
Original Mortgage
$170,000
Outstanding Balance
$132,271
Interest Rate
3.78%
Mortgage Type
New Conventional
Estimated Equity
$325,150
Purchase Details
Closed on
Oct 31, 2008
Sold by
Nguyen Quynh Thuy and Pham Phong
Bought by
Nguyen Quynh Thuy and Pham Phong
Home Financials for this Owner
Home Financials are based on the most recent Mortgage that was taken out on this home.
Original Mortgage
$136,000
Interest Rate
5.77%
Mortgage Type
Purchase Money Mortgage
Purchase Details
Closed on
Oct 27, 2008
Sold by
Ngo Thao
Bought by
Nguyen Quynh Thuy
Home Financials for this Owner
Home Financials are based on the most recent Mortgage that was taken out on this home.
Original Mortgage
$136,000
Interest Rate
5.77%
Mortgage Type
Purchase Money Mortgage
Purchase Details
Closed on
Oct 7, 2008
Sold by
Fdic
Bought by
Nguyen Quynh Thuy and Pham Phong
Home Financials for this Owner
Home Financials are based on the most recent Mortgage that was taken out on this home.
Original Mortgage
$136,000
Interest Rate
5.77%
Mortgage Type
Purchase Money Mortgage
Purchase Details
Closed on
Jun 25, 2007
Sold by
Martinez Maria De Jesus Moreno
Bought by
Indymac Bank Fsb
Purchase Details
Closed on
Jul 12, 2004
Sold by
Ngungutau Patricia
Bought by
Ngungutan Kelemani
Home Financials for this Owner
Home Financials are based on the most recent Mortgage that was taken out on this home.
Original Mortgage
$233,600
Interest Rate
6.25%
Mortgage Type
Purchase Money Mortgage
Purchase Details
Closed on
Oct 30, 2002
Sold by
Okusi Aliva M
Bought by
Ngungutau Kelemani
Home Financials for this Owner
Home Financials are based on the most recent Mortgage that was taken out on this home.
Original Mortgage
$187,000
Interest Rate
9.75%
Purchase Details
Closed on
Oct 6, 1999
Sold by
Latu Ilaisanne P and Laulea Silia L
Bought by
Okusi Aliva M
Home Financials for this Owner
Home Financials are based on the most recent Mortgage that was taken out on this home.
Original Mortgage
$126,000
Interest Rate
10.39%
Create a Home Valuation Report for This Property
The Home Valuation Report is an in-depth analysis detailing your home's value as well as a comparison with similar homes in the area
Home Values in the Area
Average Home Value in this Area
Purchase History
| Date | Buyer | Sale Price | Title Company |
|---|---|---|---|
| Pham Phong Ha | $113,500 | Chicago Title Company | |
| Nguyen Quynh Thuy | -- | None Available | |
| Nguyen Quynh Thuy | -- | Chicago Title Company | |
| Nguyen Quynh Thuy | $170,000 | Chicago Title Company | |
| Indymac Bank Fsb | $313,139 | North American Title Company | |
| Ngungutan Kelemani | -- | Commonwealth Land Title | |
| Martinez Maria Dejesus Moreno | $292,000 | Commonwealth Land Title | |
| Ngungutau Kelemani | $220,000 | New Century Title Company | |
| Okusi Aliva M | $140,000 | American Title Co |
Source: Public Records
Mortgage History
| Date | Status | Borrower | Loan Amount |
|---|---|---|---|
| Open | Pham Phong Ha | $170,000 | |
| Closed | Nguyen Quynh Thuy | $136,000 | |
| Previous Owner | Martinez Maria Dejesus Moreno | $233,600 | |
| Previous Owner | Ngungutau Kelemani | $187,000 | |
| Previous Owner | Okusi Aliva M | $126,000 | |
| Closed | Ngungutau Kelemani | $22,000 | |
| Closed | Martinez Maria Dejesus Moreno | $43,800 |
Source: Public Records
Tax History Compared to Growth
Tax History
| Year | Tax Paid | Tax Assessment Tax Assessment Total Assessment is a certain percentage of the fair market value that is determined by local assessors to be the total taxable value of land and additions on the property. | Land | Improvement |
|---|---|---|---|---|
| 2025 | $4,553 | $218,903 | $65,671 | $153,232 |
| 2024 | $4,553 | $214,612 | $64,383 | $150,229 |
| 2023 | $4,808 | $210,404 | $63,121 | $147,283 |
| 2022 | $4,508 | $206,280 | $61,884 | $144,396 |
| 2021 | $4,195 | $202,236 | $60,671 | $141,565 |
| 2020 | $4,148 | $200,164 | $60,049 | $140,115 |
| 2019 | $3,919 | $196,240 | $58,872 | $137,368 |
| 2018 | $3,841 | $192,393 | $57,718 | $134,675 |
| 2017 | $3,668 | $188,621 | $56,586 | $132,035 |
| 2016 | $3,478 | $184,924 | $55,477 | $129,447 |
| 2015 | $3,457 | $182,147 | $54,644 | $127,503 |
| 2014 | $3,413 | $178,581 | $53,574 | $125,007 |
Source: Public Records
Map
Nearby Homes
- 1436 52nd Ave
- 5483 Wadean Place
- 5217 Bancroft Ave
- 5421 Wentworth Ave
- 5540 E 17th St
- 1605 57th Ave
- 1830 Vicksburg Ave
- 1424 57th Ave
- 1433 50th Ave
- 1604 57th Ave
- 5715 E 16th St
- 1507 48th Ave
- 5444 Bancroft Ave
- 2100 51st Ave
- 1434 47th Ave
- 1244 58th Ave
- 4709 Foothill Blvd
- 2007 57th Ave
- 2125 51st Ave
- 5910 International Blvd
- 5415 Crittenden St
- 5433 Crittenden St
- 5409 Crittenden St
- 5445 Crittenden St
- 1536 54th Ave
- 1528 54th Ave
- 5424 Holland St
- 5410 Holland St
- 5451 Crittenden St
- 5418 Holland St
- 5434 Holland St
- 5404 Holland St
- 5430 Crittenden St
- 5436 Crittenden St
- 5410 Crittenden St
- 5400 Crittenden St
- 5455 Crittenden St
- 5438 Holland St
- 5438 Crittenden St
- 5440 Crittenden St